


Labor Activity
in Healthcare
An analysis of labor activity for the years 2024 and 2025 and insights from subject matter experts on current labor and employee relations issues
Table of contents
Welcome
Analysis
Labor Insights
Case Studies
Inside this report
People Results’ 2026 Labor Activity in Healthcare Report provides healthcare industry subject matter expertise and timely information about labor activity. The report contains the following:
- An analysis of national, regional, and state representation and decertification petitions and elections (RC, RM, and RD)1 as reported by the National Labor Relations Board (NLRB) during 2024 and 20252 and analyzed by People Results’ Research & People Analytics team
- Articles written by labor experts about current labor or employee engagement issues impacting employers and the workplace
- Case studies that highlight People Results’ work with healthcare organizations to enhance employee engagement and ensure labor relations readiness
1 See Appendix C for detailed definitions of the types of petitions and elections.
2 NLRB election data describes dynamic case activity that is subject to revision and corrections during the year, and all data in this report should be interpreted with that understanding.

A message from our labor practice leadership
Employers across all industries anticipated changes to the NLRB in 2025 that would be brought on by the new administration. But those changes would ultimately take a backseat to a severe case backlog caused by the Board’s lack of quorum that would last most of the year.
The healthcare industry experienced continued workforce growth amid the persistence of staffing shortages in 2025. The number of union elections in healthcare decreased compared to the previous year, but labor’s win rate increased, as did the number of healthcare strikes.
Going forward, with the NLRB quorum issues now resolved, we can expect to see changes within the Board that may help slow labor’s push, but healthcare leaders remain cautious. Ongoing uncertainties remain surrounding tariffs, drug pricing, and regulatory changes. At the same time, while rapid advances in technology—particularly AI-driven platforms—are redefining how care can be delivered and how teams can be supported, the low percentage of AI deployment across systems means most healthcare executives do not expect a major strategic impact from AI in 2026.
Meanwhile, persistent challenges remain, from staffing shortages and turnover to burnout prevention and the realities of retirement surge. Such challenges may pressure healthcare workers even further—and impact labor relations. Certainly, we can expect labor unions to use these ongoing challenges to target employers.
Other critical developments that could have a significant impact on healthcare organizations include:
Pivot to Direct Action
As the NLRB moves forward with a more employer-friendly agenda (and, likely, aims to reverse rulings like Stericycle, Thryv, Cemex, and Amazon), unions may shift their focus to increasing direct labor actions, such as picketing and grievance filing.
Pay Transparency Laws
Pay transparency laws continue to expand nationwide, creating new compliance obligations and new litigation risks for employers. Multi-state companies are particularly at risk, facing a complex environment of requirements that vary by jurisdiction.
State and Local AI Regulation
Given the lack of a national AI law, regulatory framework is emerging at the state level, with more states introducing their own laws and legislative proposals. This growing patchwork of laws will likely continue into 2026.
Challenging Immigration Landscape To Continue
New rules are expected to alter wage calculations for H-1B visas, potentially raising costs, while I-9 compliance audits and worksite visits are rising.
For all these reasons, 2026 will require continued agility from businesses. We are likely to see more targeted organizing by both traditional and independent unions, resulting in more union election wins. With the NLRB quorum now in place, and anticipated rollbacks of Biden-era laws, expect unions to return to more traditional organizing tactics and strategies.
The enclosed Labor Activity in Healthcare Report delivers the latest data on union organizing and membership nationwide, as well as timely labor and employee relations articles, designed to help you make sense of the challenging year ahead. We look forward to continuing to support healthcare organizations throughout the country and providing you with up-to-date and relevant labor information affecting your industry.
About research & people analytics
People Results’ Research & People Analytics (R&PA) team analyzed the NLRB and other data presented throughout this report. R&PA is an integral part of our firm’s work and is embedded across our services to help clients’ leaders make smarter, faster, and more data-driven decisions.
The R&PA team develops insights for leaders related to labor and employee relations analytics, workforce and engagement research, predictive risk modeling, and executive-level reporting. By combining advanced analytics with deep labor expertise, People Results helps employers identify emerging risk, define proactive employee relations strategies, and support labor relations with credible, evidence-based insight that strengthens strategy and outcomes.
Dr. Fiona Jamison leads our R&PA team of researchers, analysts, and developers. To learn more about People Results’ R&PA services, contact Fiona at: [email protected].
Delivering solutions tailor-made for your industry and needs

Summary of analysis
In 2025, there were 390 representation petitions3 filed in healthcare, a 21 percent decrease from the 492 petitions filed in 2024.
Unions achieved an 87 percent success rate in the 306 representation elections held in the industry in 2025. This was just slightly lower than the decade-high 90 percent win rate of the year prior.
Sixty-two percent of petitions in 2025 were filed in just six states—California, Washington, Oregon, New York, Pennsylvania, and Minnesota. These states consistently rank among the most active in the healthcare industry. In 2024, their share made up 59 percent of petitions filed.
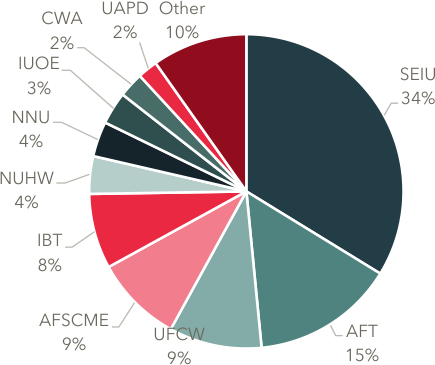
The Service Employees International Union (SEIU) remains the most active union in healthcare, accounting for 34 percent of the petitions filed and 38 percent of the elections held. SEIU was elected as a result of 89 percent of the 116 elections it was involved in.
Over the past decade, most strikes in healthcare were held in California, New York, Illinois, Minnesota, and Pennsylvania. California experienced nearly 5 times as many strikes as New York—the next most active state. In 2025, there were 51 strikes in healthcare, idling a total of 292,388 workers.4
3 Throughout this report, unless otherwise noted, a combination of RC (Certification of Representative) and RM (Employer Petition) cases is used anytime we discuss representation petitions and elections.
4 Strike data is compiled from the Bloomberg BNA Work Stoppages Database.

Union membership nationwide
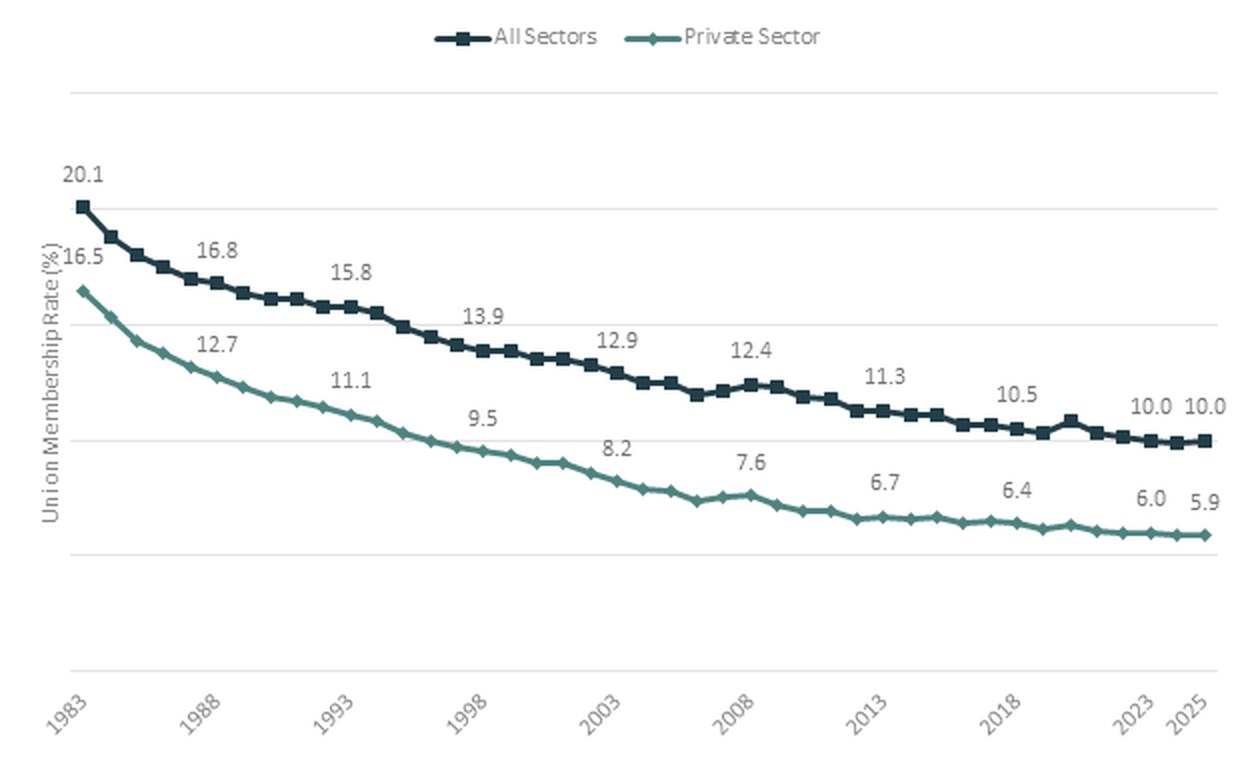
According to the U.S. Department of Labor Bureau of Labor Statistics (BLS) Union Members—2025 report, the union membership rate (the percentage of wage and salary workers who were members of unions) for 2025 was 10.0 percent—only a slight change from the prior year—and the number of wage and salary workers belonging to unions was 14.7 million.
BLS notes that the Current Population Survey (CPS) for October 2025 was not collected due to the federal government shutdown that occurred from October 1 to November 12, 2025. As a result, 2025 annual estimates are 11-month averages that exclude October and are not strictly comparable with annual averages for other years.
Data from the BLS report include the following highlights:
- The union membership rate was 10.0 percent in 2025—showing little change from 2024
- The union membership rate of public-sector workers (32.9 percent) continued to be more than five times higher than the rate of private-sector workers (5.9 percent)
- The highest union membership rate is among men aged 45 to 54 (12.8 percent), while the lowest is among women aged 16 to 24 (3.9 percent)
- Black workers remained more likely to be union members (11.4 percent) than White (9.9 percent), Asian (8.7 percent), and Hispanic (8.9 percent) workers
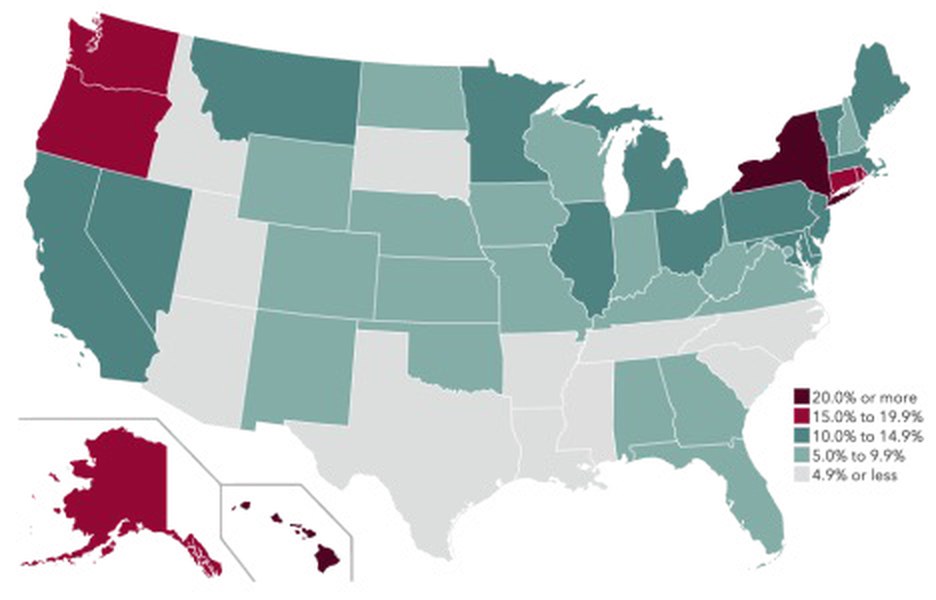
- Among states, Hawaii had the highest union membership rate (24.8 percent), while South Carolina had the lowest (2.0 percent); BLS notes that state union membership data for 2025 are based on relatively few observations and, because October 2025 CPS data were not collected due to the federal government shutdown, state estimates should be interpreted with caution
National summaries
Representation petitions filed
Unions filed 363 RC petitions in healthcare in 2025. That, plus the 27 RM petitions, resulted in 390 representation petitions filed in the year—a sharp decrease from the 492 petitions filed in 2024. RC petitions had risen steadily since 2021, peaking sharply in 2024. RM petitions remain a small share of the total representation petitions.
Representation petitions filed by month
The following chart compares the number of petitions filed each month of 2024 versus the number filed during the same month 2025. Petition activity in 2025 tracked below 2024 levels for most of the year, with the largest gaps emerging in late summer and early fall, including a pronounced dip in October due to the government shutdown that occurred from October 1 to November 12, 2025.
Union wins in representation elections
Union success in representation elections compared to the number of elections held
The chart below shows the union win rate compared to the number of elections held each year. Election activity rose sharply after the 2020 low, peaking in 2024 before easing modestly in 2025, signaling sustained but slightly cooling organizing momentum. Despite fluctuations in volume, union win rates remained consistently high—generally near or above 80 percent—indicating continued strength in election outcomes.
Healthcare vs. non-healthcare industries
Unions in the healthcare industry consistently outperform those in non-healthcare industries, with unions maintaining a higher win rate every year from 2016 to 2025. In 2025, there was an 11-percentage point gap between healthcare and non-healthcare industries.
Union wins in decertification elections
Healthcare vs. non-healthcare industries
Though the healthcare industry performs slightly better, union decertification win rates are still materially lower than representation win rates in most years. However, in 2025, unions maintained recognition in 71 percent of decertification elections—the most in the past decade.


State summaries
Representation petitions filed in healthcare
Overall petition filings declined 21 percent year over year driven by notable declines in New York and Massachusetts. California remained the single largest source of petitions in both years. Activity shifted toward a few states where union activity grew, including New Jersey, Vermont, New Mexico, and Montana.
| State | 2024 | 2025 | State | 2024 | 2025 | State | 2024 | 2025 |
|---|---|---|---|---|---|---|---|---|
| Alabama | - | 4 | Louisiana | 1 | - | Oklahoma | - | - |
| Alaska | 1 | 1 | Maine | 2 | - | Oregon | 42 | 39 |
| Arizona | 2 | - | Maryland | 6 | 5 | Pennsylvania | 26 | 22 |
| Arkansas | - | - | Massachusetts | 29 | 11 | Puerto Rico | 4 | 2 |
| California | 79 | 79 | Michigan | 25 | 13 | Rhode Island | 6 | 2 |
| Colorado | 3 | 1 | Minnesota | 28 | 21 | South Carolina | 1 | 1 |
| Connecticut | 10 | 4 | Mississippi | - | - | South Dakota | - | - |
| Delaware | 5 | - | Missouri | 2 | 4 | Tennessee | - | - |
| District of Columbia | 3 | 2 | Montana | 6 | 8 | Texas | 2 | 1 |
| Florida | 2 | 1 | Nebraska | - | - | Virgin Islands | - | - |
| Georgia | 1 | 2 | Nevada | 6 | 2 | Utah | - | 1 |
| Hawaii | 8 | 5 | New Hampshire | 1 | 2 | Vermont | 7 | 15 |
| Idaho | - | - | New Jersey | 13 | 19 | Virginia | - | 2 |
| Illinois | 19 | 11 | New Mexico | 1 | 5 | Washington | 42 | 53 |
| Indiana | 6 | 5 | New York | 74 | 31 | West Virginia | 3 | - |
| Iowa | 1 | 3 | North Carolina | 1 | 1 | Wisconsin | 5 | 3 |
| Kansas | 2 | - | North Dakota | 1 | - | Wyoming | 1 | - |
| Kentucky | - | - | Ohio | 15 | 9 | – | – | |
| TOTAL | – | – | – | – | 492 | 390 |


Representation elections results in healthcare
Representation elections declined from 354 in 2024 to 306 in 2025, while the overall union win rate remained very high. Much of the volume shift came from major states like New York (53 elections in 2024 → 19 elections in 2025) and Washington (28 elections in 2024 → 45 elections in 2025), indicating activity rebalanced across key markets even as overall wins stayed strong.
| State | 2024 | 2025 | State | 2024 | 2025 | ||||
|---|---|---|---|---|---|---|---|---|---|
| # of Elections | Union Win Rate | # of Elections | Union Win Rate | # of Elections | Union Win Rate | # of Elections | Union Win Rate | ||
| Alabama | - | - | 2 | 50% | Nebraska | - | - | - | - |
| Alaska | 1 | 100% | 1 | 100% | Nevada | 2 | 100% | 4 | 75% |
| Arizona | - | - | - | - | New Hampshire | 1 | 100% | 2 | 50% |
| Arkansas | - | - | - | - | New Jersey | 6 | 100% | 8 | 88% |
| California | 61 | 87% | 66 | 83% | New Mexico | - | - | 2 | 100% |
| Colorado | 2 | 50% | 1 | 100% | New York | 53 | 91% | 19 | 100% |
| Connecticut | 3 | 100% | 4 | 100% | North Carolina | 2 | 100% | - | - |
| Delaware | 3 | 100% | 1 | 100% | North Dakota | 1 | 100% | - | - |
| District of Columbia | 2 | 100% | 1 | 100% | Ohio | 10 | 100% | 2 | 100% |
| Florida | 2 | 50% | 1 | 100% | Oklahoma | - | - | - | - |
| Georgia | 1 | 100% | 1 | 0% | Oregon | 35 | 100% | 34 | 97% |
| Hawaii | 7 | 100% | 5 | 60% | Pennsylvania | 18 | 83% | 17 | 82% |
| Idaho | - | - | - | - | Puerto Rico | 3 | 67% | 2 | 50% |
| Illinois | 21 | 86% | 13 | 92% | Rhode Island | 1 | 100% | 6 | 100% |
| Indiana | 5 | 60% | 4 | 25% | South Carolina | 1 | 100% | 1 | 0% |
| Iowa | 1 | 0% | 1 | 100% | South Dakota | - | - | - | - |
| Kansas | 1 | 100% | 1 | 100% | Tennessee | - | - | - | - |
| Kentucky | - | - | - | - | Texas | 2 | 50% | 1 | 100% |
| Louisiana | - | - | - | - | Virgin Islands | - | - | - | - |
| Maine | 3 | 67% | - | - | Utah | - | - | - | - |
| Maryland | 4 | 100% | 4 | 75% | Vermont | 6 | 100% | 11 | 91% |
| Massachusetts | 19 | 89% | 11 | 91% | Virginia | - | - | 1 | 100% |
| Michigan | 17 | 71% | 7 | 57% | Washington | 28 | 96% | 45 | 93% |
| Minnesota | 20 | 95% | 19 | 95% | West Virginia | 2 | 100% | 1 | 0% |
| Mississippi | - | - | - | - | Wisconsin | 4 | 100% | 1 | 100% |
| Missouri | - | - | - | - | Wyoming | 1 | 100% | - | - |
| Montana | 5 | 80% | 6 | 100% | – | – | – | – | |
| TOTAL | – | – | – | – | 354 | 90% | 306 | 87% | |
Union summaries
Most active unions – representation petitions filed in healthcare
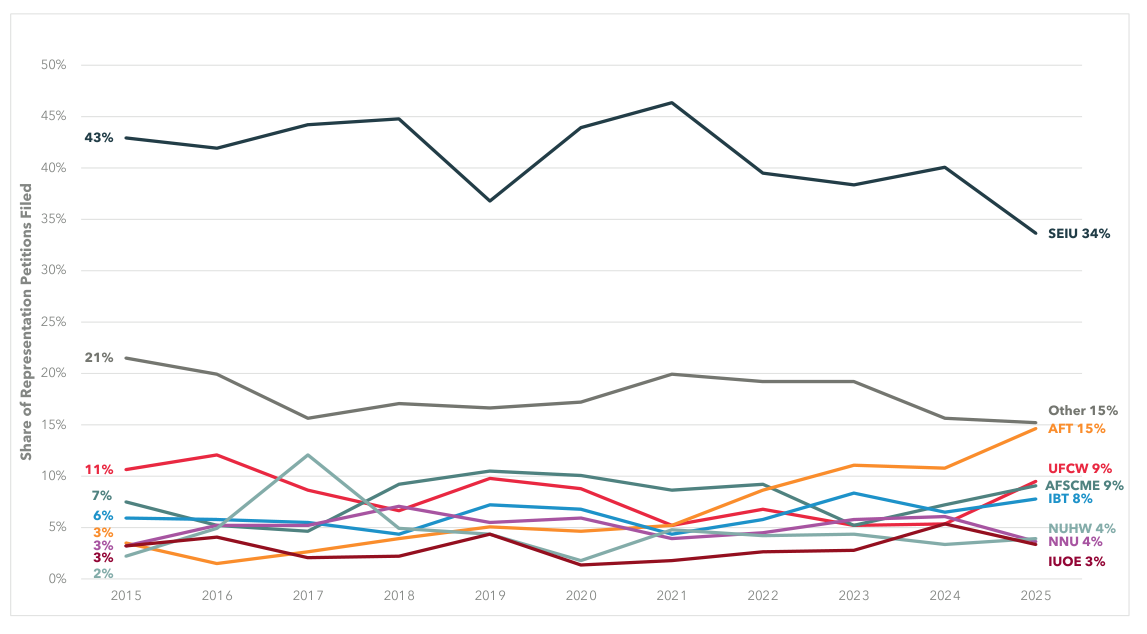
The Service Employees International Union (SEIU) remained the most active union in the healthcare industry, but its share fell to 34 percent—the lowest level observed in the past decade. Though SEIU has consistently led representation petition activity in the industry over the last 10 years, its share has been trending downward in recent years.
In contrast, the American Federation of Teachers (AFT) showed the clearest upward trajectory and ranked as the second most active union in 2025. Most other unions remained comparatively flat with smaller year-to-year fluctuations, indicating a modest shift toward a more competitive organizing landscape in the industry.
| Abbreviation | Union Name | Representation Petitions Filed | |
|---|---|---|---|
| 2024 | 2025 | ||
| SEIU | Service Employees International Union | 197 | 131 |
| AFT | American Federation of Teachers | 53 | 57 |
| UFCW | United Food and Commercial Workers | 26 | 37 |
| AFSCME | American Federation of State, County and Municipal Employees | 35 | 35 |
| IBT | International Brotherhood of Teamsters | 32 | 30 |
| NUHW | National Union of Healthcare Workers | 16 | 15 |
| NNU | National Nurses United | 30 | 14 |
| IUOE | International Union of Operating Engineers | 26 | 13 |
| CWA | Communication Workers of America | 3 | 10 |
| UAPD | Union of American Physicians and Dentists | 1 | 8 |
Most active unions – representation elections held in healthcare
SEIU accounted for nearly 40 percent of the representation elections held in 2025, and it was elected as a result of 89 percent of these elections. This is a slight decrease from SEIU’s 94 percent win rate in 2024. AFT won 98 percent of the 44 elections it was involved in in 2025.
| Union | 2024 | 2025 | ||
|---|---|---|---|---|
| # of Elections | Union Win Rate | # of Elections | Union Win Rate | |
| SEIU | 126 | 94% | 116 | 89% |
| AFT | 43 | 100% | 44 | 98% |
| AFSCME | 23 | 78% | 30 | 90% |
| IBT | 26 | 77% | 22 | 68% |
| UFCW | 17 | 88% | 22 | 68% |
| IUOE | 20 | 90% | 14 | 93% |
| NUHW | 13 | 92% | 12 | 92% |
| NNU | 29 | 93% | 10 | 100% |
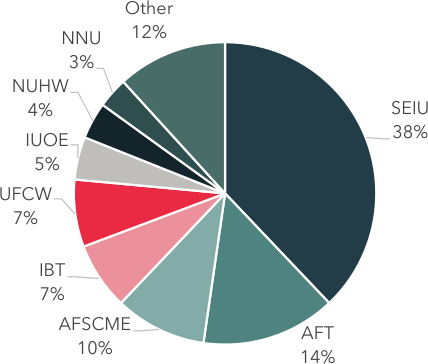
The following table lists other unions that are active in the industry and referenced in this report.
| Abbreviation | Union Name |
|---|---|
| AEP | American Electric Power |
| ATU | Amalgamated Transit Union |
| CLA | Christian Labor Association |
| CRONA | Committee For Recognition of Nursing Achievement |
| FCGOA | Federal Contract Guards of America |
| IAM | International Association of Machinists and Aerospace Workers |
| IBEW | International Brotherhood of Electrical Workers |
| IFPTE | International Federation of Professional and Technical Engineers |
| IUJAT | International Union of Journeymen and Allied Trades |
| LIUNA | Laborers' International Union of North America |
| MAP | Metropolitan Alliance of Police |
| MNA (MA) | Massachusetts Nurses Association |
| OPEIU | Office and Professional Employees International Union |
| PASNAP | Pennsylvania Association of Staff Nurses and Allied Professionals |
| SPFPA | Security, Police and Fire Professionals of America |
| SSOBA | Special and Superior Officers Benevolent Association |
| TWU | Transport Workers Union of America |
| UAW | United Automobile, Aerospace and Agricultural Implement Workers of America Autoworkers (United Autoworkers) |
| UFLEOS-PBA | United Federation Law Enforcement Officers Security & Police Benevolent Association |
| UMWA | United Mine Workers of America |
| UNAP | United Nurses & Allied Professionals |
| UPSEU | United Public Service Employees Union |
| USPOA | United Security & Police Officers of America |
| USW | United Steelworkers |
Regional summaries
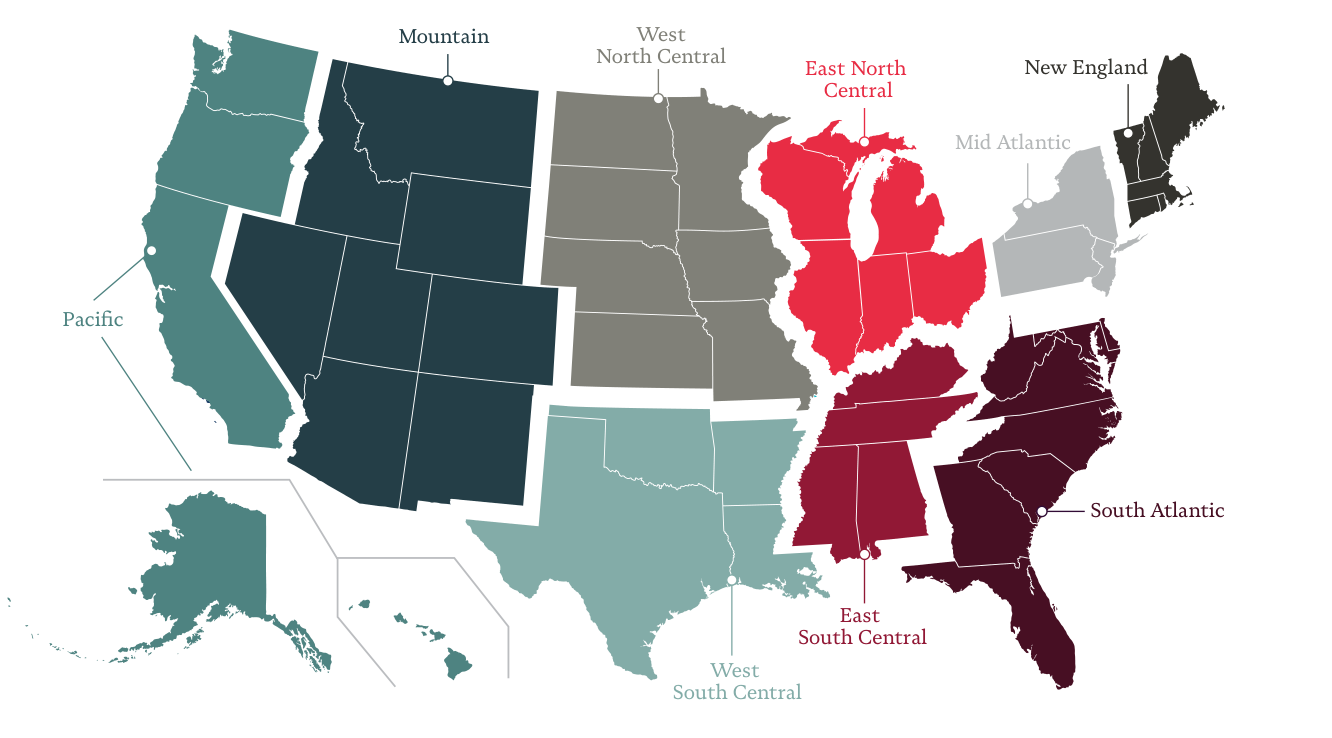
For this analysis, we have categorized the nation into nine regions, as illustrated in the map below. The following sections provide an overview of activity in each region in 2024 and 2025.
Pacific
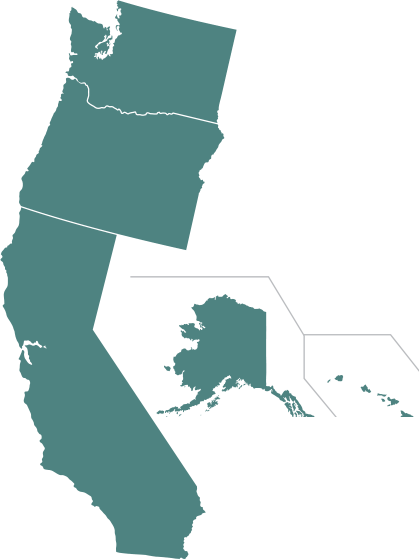
Unions experienced an 89 percent win rate in the region in 2025, down from 93 percent in 2024. California, Oregon, and Washington drive most of the region’s activity, with consistently high petition counts and union win rates in both 2024 and early 2025. Washington saw a notable increase in activity, albeit with a slightly lower win rate.
| State | 2024 | 2025 | ||||
|---|---|---|---|---|---|---|
| Petitions Filed | Elections Held | Union Win Rate | Petitions Filed | Elections Held | Union Win Rate | |
| Alaska | 1 | 1 | 100% | 1 | 1 | 100% |
| California | 79 | 61 | 87% | 79 | 66 | 83% |
| Hawaii | 8 | 7 | 100% | 5 | 5 | 60% |
| Oregon | 42 | 35 | 100% | 39 | 34 | 97% |
| Washington | 42 | 28 | 96% | 53 | 45 | 93% |
| Active Unions | SEIU, AFT, NUHW, UFCW, AFSCME, IBT, IUOE, OPEIU, UAPD, NNU, UFLEOS-PBA, IFPTE, IAM, USW, LIUNA, IBEW, CWA, CRONA | |||||
Mountain
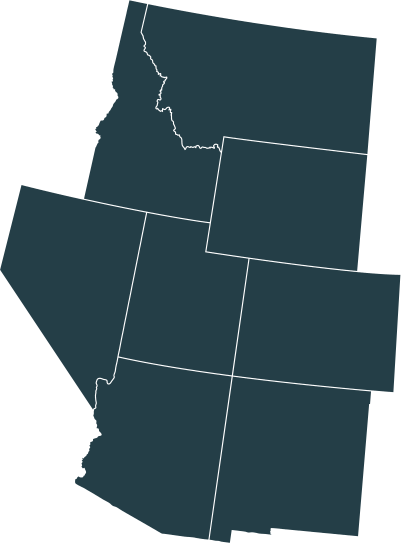
Unions experienced a 92 percent win rate in the region in 2025, up notably from 80 percent in 2024. Most states in the region saw some organizing activity in 2024 or 2025. New Mexico experienced a notable increase in activity.
| State | 2024 | 2025 | ||||
|---|---|---|---|---|---|---|
| Petitions Filed | Elections Held | Union Win Rate | Petitions Filed | Elections Held | Union Win Rate | |
| Arizona | 2 | - | - | - | - | - |
| Colorado | 3 | 2 | 50% | 1 | 1 | 100% |
| Idaho | - | - | - | - | - | - |
| Montana | 6 | 5 | 80% | 8 | 6 | 100% |
| Nevada | 6 | 2 | 100% | 2 | 4 | 75% |
| New Mexico | 1 | - | - | 5 | 2 | 100% |
| Utah | - | - | - | 1 | - | - |
| Wyoming | 1 | 1 | 100% | - | - | - |
| Active Unions | SEIU, AFT, CWA, AFSCME, NNU, USW, UFCW, UAPD, SPFPA, IAM | |||||
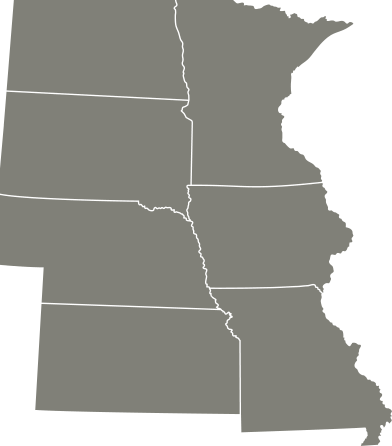
West North Central
Unions experienced a 95 percent win rate in the region in 2025, compared to 91 percent in 2024. Minnesota drives most of the activity in the region.
| State | 2024 | 2025 | ||||
|---|---|---|---|---|---|---|
| Petitions Filed | Elections Held | Union Win Rate | Petitions Filed | Elections Held | Union Win Rate | |
| Iowa | 1 | 1 | 0% | 3 | 1 | 100% |
| Kansas | 2 | 1 | 100% | - | 1 | 100% |
| Minnesota | 28 | 20 | 95% | 21 | 19 | 95% |
| Missouri | 2 | - | - | 4 | - | - |
| Nebraska | - | - | - | - | - | - |
| North Dakota | 1 | 1 | 100% | - | - | - |
| South Dakota | - | - | - | - | - | - |
| Active Unions | SEIU, NNU, AFSCME, IBT, USW, UFCW, IBEW, CLA, ATU | |||||
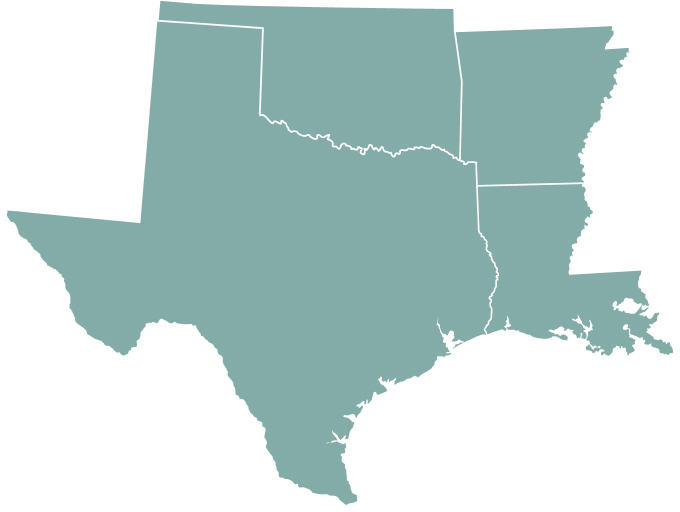
West South Central
Unions experienced a 100 percent win rate in the region in 2025, compared to 50 percent in 2024. This volatility in win rate is due to the extremely limited organizing activity in the region—just three elections have been held over the last two years.
| State | 2024 | 2025 | ||||
|---|---|---|---|---|---|---|
| Petitions Filed | Elections Held | Union Win Rate | Petitions Filed | Elections Held | Union Win Rate | |
| Arkansas | - | - | - | - | - | - |
| Louisiana | 1 | - | - | - | - | - |
| Oklahoma | - | - | - | - | - | - |
| Texas | 2 | 2 | 50% | 1 | 1 | 100% |
| Active Unions | NNU, UFLEOS-PBA, CWA | |||||
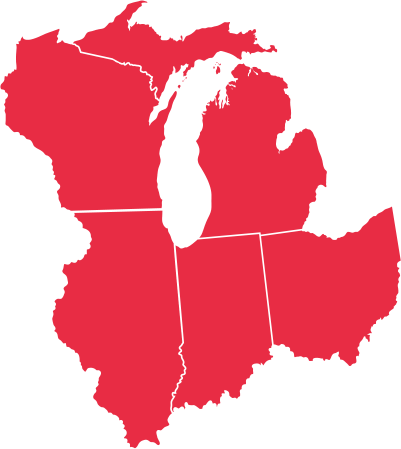
East North Central
Unions experienced a 74 percent win rate in the region in 2025, down from 82 percent in 2024. All states in this region have experienced organizing activity in the last two years and all states saw less activity in 2025 than in 2024.
| State | 2024 | 2025 | ||||
|---|---|---|---|---|---|---|
| Petitions Filed | Elections Held | Union Win Rate | Petitions Filed | Elections Held | Union Win Rate | |
| Illinois | 19 | 21 | 86% | 11 | 13 | 92% |
| Indiana | 6 | 5 | 60% | 5 | 4 | 25% |
| Michigan | 25 | 17 | 71% | 13 | 7 | 57% |
| Ohio | 15 | 10 | 100% | 9 | 2 | 100% |
| Wisconsin | 5 | 4 | 100% | 3 | 1 | 100% |
| Active Unions | SEIU, IBT, IUOE, UFCW, NNU, AFSCME, UAW, SPFPA, AFT, USW, OPEIU, MAP, LIUNA, IAM, AEP | |||||
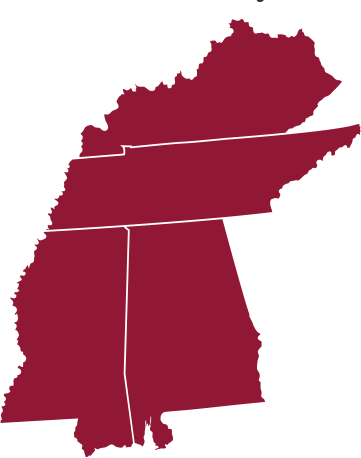
East South Central
In 2025, unions experienced a 50 percent win rate in the region, and there were no elections in the region in 2024. Alabama is the only state in the region with recorded activity.
| State | 2024 | 2025 | ||||
|---|---|---|---|---|---|---|
| Petitions Filed | Elections Held | Union Win Rate | Petitions Filed | Elections Held | Union Win Rate | |
| Alabama | - | - | - | 4 | 2 | 50% |
| Kentucky | - | - | - | - | - | - |
| Mississippi | - | - | - | - | - | - |
| Tennessee | - | - | - | - | - | - |
| Active Unions | UFCW | |||||
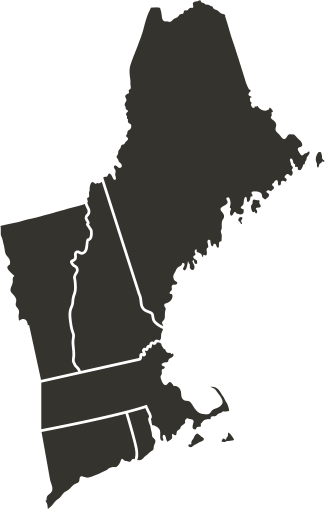
New England
Unions experienced a 91 percent win rate in the region in 2025—the same as in 2024. Massachusetts and Connecticut saw notable drop offs in activity in 2025, while Vermont had a sizable uptick in activity.
| State | 2024 | 2025 | ||||
|---|---|---|---|---|---|---|
| Petitions Filed | Elections Held | Union Win Rate | Petitions Filed | Elections Held | Union Win Rate | |
| Connecticut | 10 | 3 | 100% | 4 | 4 | 100% |
| Maine | 2 | 3 | 67% | - | - | - |
| Massachusetts | 29 | 19 | 89% | 11 | 11 | 91% |
| New Hampshire | 1 | 1 | 100% | 2 | 2 | 50% |
| Rhode Island | 6 | 1 | 100% | 2 | 6 | 100% |
| Vermont | 7 | 6 | 100% | 15 | 11 | 91% |
| Active Unions | SEIU, AFT, MNA (MA), AFSCME, UNAP, UFCW, IUOE, IBT, UAW, OPEIU, NNU, IBEW | |||||
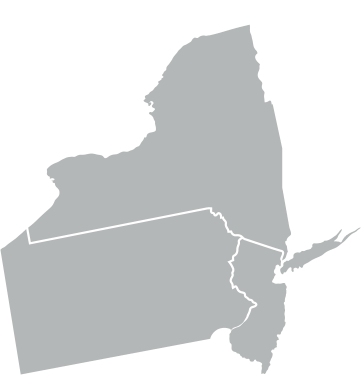
Mid Atlantic
Unions experienced a 91 percent win rate in the region in 2025, similar to the 90 percent win rate in 2024. All of the states in the region regularly experience organizing activity. New York continued to lead the region in activity despite a dramatic drop off in organizing in 2024.
| State | 2024 | 2025 | ||||
|---|---|---|---|---|---|---|
| Petitions Filed | Elections Held | Union Win Rate | Petitions Filed | Elections Held | Union Win Rate | |
| New Jersey | 13 | 6 | 100% | 19 | 8 | 88% |
| New York | 74 | 53 | 91% | 31 | 19 | 100% |
| Pennsylvania | 26 | 18 | 83% | 22 | 17 | 82% |
| Active Unions | SEIU, UFCW, AFSCME, IBT, AFT, PASNAP, IUOE, NNU, CWA, USW, UPSEU, SPFPA, UAW, TWU, NUHW, USPOA, UMWA, UFLEOS-PBA, SSOBA, OPEIU, IUJAT, IBEW, FCGOA | |||||
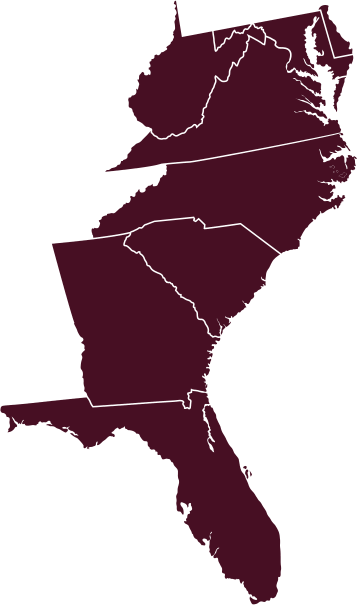
South Atlantic
Unions experienced just a 64 percent win rate in the region in 2025, down from 94 percent in 2024. All of the states in the region saw some activity, but unions were less successful in this region than in most of the other regions.
| State | 2024 | 2025 | ||||
|---|---|---|---|---|---|---|
| Petitions Filed | Elections Held | Union Win Rate | Petitions Filed | Elections Held | Union Win Rate | |
| Delaware | 5 | 3 | 100% | – | 1 | 100% |
| District of Columbia | 3 | 2 | 100% | 2 | 1 | 100% |
| Florida | 2 | 2 | 50% | 1 | 1 | 100% |
| Georgia | 1 | 1 | 100% | 2 | 1 | 0% |
| Maryland | 6 | 4 | 100% | 5 | 4 | 75% |
| North Carolina | 1 | 2 | 100% | 1 | – | – |
| South Carolina | 1 | 1 | 100% | 1 | 1 | 0% |
| Virginia | – | – | – | 2 | 1 | 100% |
| West Virginia | 3 | 2 | 100% | 0 | 1 | 0% |
| Active Unions | SEIU, IBT, UFCW, IAM, AFSCME, USW, NNU, IUOE, AFT | |||||


Strikes in healthcare
Healthcare strikes are heavily clustered in a few states, led by California (111 strikes) and followed by New York (24), Illinois (21), Minnesota (20), and Pennsylvania (19). Strike activity is more common along the coast and through the Midwest.
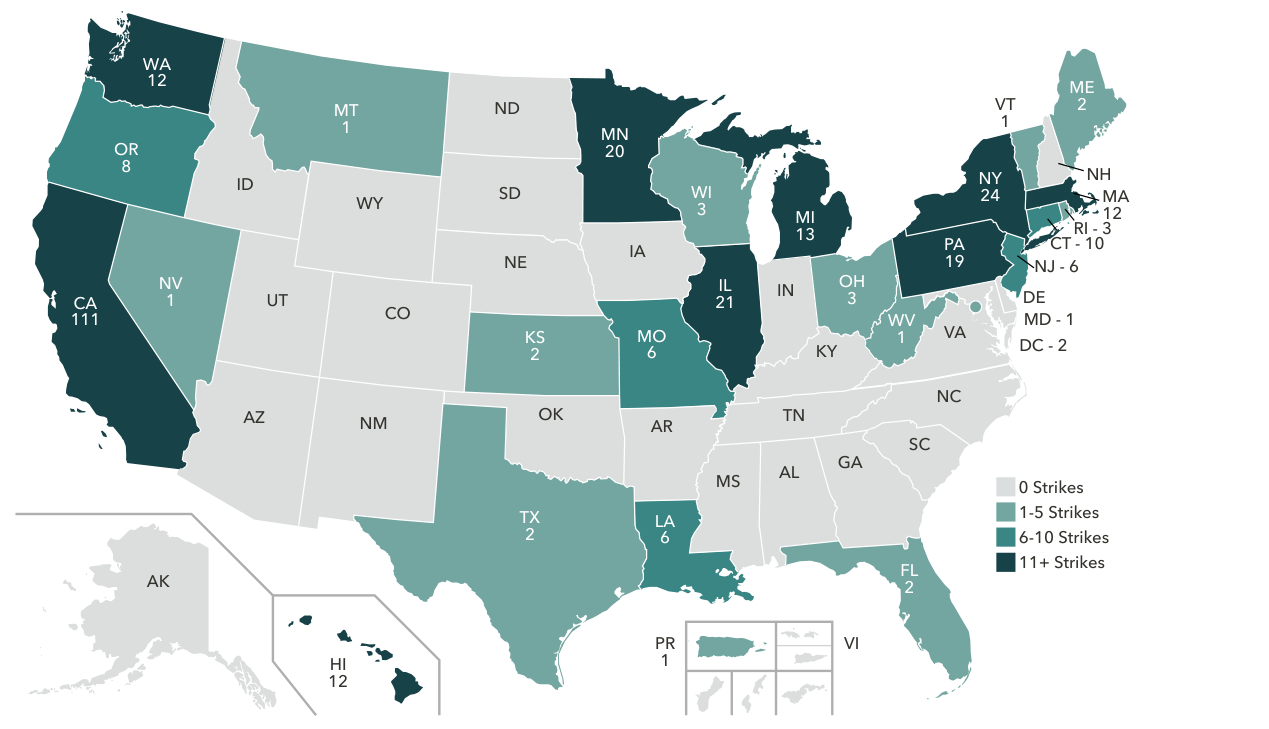
In 2025, there were 51 healthcare strikes that idled 292,388 workers. This resulted in the highest average number of workers per strike in the last decade.
| Year | Number of Strikes | Workers Idled | Average Number of Workers per Strike |
|---|---|---|---|
| 2025 | 51 | 292,388 | 5,733 |
| 2024 | 31 | 63,636 | 2,053 |
| 2023 | 52 | 116,226 | 2,235 |
| 2022 | 38 | 44,345 | 1,167 |
| 2021 | 30 | 53,120 | 1,771 |
| 2020 | 23 | 25,875 | 1,125 |
| 2019 | 27 | 107,470 | 3,980 |
| 2018 | 27 | 104,056 | 3,854 |
| 2017 | 17 | 4,100 | 241 |
| 2016 | 11 | 17,565 | 1,597 |
Article summaries
New Year, New NLRB, No Shifts in Precedent…Yet
In 2025, the National Labor Relations Board regained both a quorum and a General Counsel—but its anticipated course reversal on some of the “union-friendly” Biden Board’s actions has not yet taken place. In this article, find out what’s holding up these reversals, and what the General Counsel’s current focus is for the immediate future.
A Cooling Labor Market Beneath the Headlines: What the Latest Jobs Data Means for Employers and Job Seekers
The present labor market is neither booming nor collapsing. It is, in fact, transitioning. What does that mean for employers? This article explores what’s happening in the current labor market as employers face simultaneous impacts from factors like artificial intelligence adoption, economic uncertainty and rising costs, shifts in labor supply, and evolving workforce priorities.
Bridging the Gap: How Federal Workforce Investments Are Reshaping Employer Recruitment and Retention Strategies
Though the worker shortage in the U.S. has largely stabilized, employers are still finding it challenging to recruit and retain the talent they need. This is because the structural challenges that created the shortage—for example, an aging workforce and a childcare crisis—still exist. This article highlights programs coming in 2026 to assist employers with these challenges and how employers can take advantage of them.
Intentional Survivor Management: No One Is “Lucky” in a Layoff
Much is made about the impact of layoffs on those who lose their jobs—and rightly so—but far less attention is paid to the employees who remain. These “survivors” are left to navigate uncertainty, increased workload, and emotional fallout. We sat down with Dr. Fiona Jamison to discuss why survivor management matters and how organizations can approach it intentionally.
Post-Strike Healing: It’s Not Over Til It’s Over
The end of a strike doesn’t signal the end of the conflict. To ensure future productivity, corporate resilience, and the well-being of all involved parties, post-strike healing must take place, regardless of the outcome of the strike itself. Explore the processes of Post-Strike Interventions and Post-Strike Recovery in this eye-opening article.

New Year, New NLRB, No Shifts in Precedent…Yet
The National Labor Relations Board (“Board” or “NLRB”) is off to a different start this year. Following the earlier terminations of Board Chair Gwynne Wilcox (D) and General Counsel Jennifer Abruzzo (D) and delays by the Administration and U.S. Senate with respect to nominations for replacements, the NLRB spent most of 2025 without a quorum and with an Acting General Counsel. This year, the Board regained both a quorum and a General Counsel.
Although we anticipate the new NLRB will reverse course on a number of actions by the Biden Administration—which include several decisions that make it easier for unions to organize employees—early indications are that changes may be months away. As a result, now is the time for employers to understand the playing field and have a labor relations plan in place that accounts for likely NLRB changes over time.
The Board once again has a quorum, but precedent changing decisions unlikely until NLRB has three Republican Board Members
The National Labor Relations Act (“NLRA”) provides for five Board Members, but the NLRB only needs to have three sitting members for a quorum. When President Trump took office, the NLRB had three Board Members: Wilcox (D), David Prouty (D), and Marvin Kaplan (R).
Wilcox was terminated shortly after, which left the NLRB without a quorum. The President subsequently nominated two new Board Members, namely, Scott Mayer (R) and James Murphy (R), but Kaplan’s term then expired, leaving the NLRB with just one Board Member. In December 2025, the Senate confirmed Mayer and Murphy. They were sworn into office in January 2026 thereby giving the NLRB a quorum once again.
Many wondered whether the new majority would reverse certain “union-friendly” decisions previously issued under the Biden Board at the first opportunity. Early signs indicate that the NLRB will wait until it has a three-member majority. For example, in Lodi Volunteer Ambulance Rescue Squad, Inc., 374 NLRB No. 26 (Jan. 28, 2026), the Board declined the opportunity to reverse the NLRB’s decision in Thryv, Inc., 372 NLRB No. 22 (2022), which requires an employer to compensate employees for “direct or foreseeable pecuniary harms incurred as a result of their unlawful discharge . . . .” Id. at slip op. 3. Mayer and Murphy decided there was “no need at this time to express an opinion whether the novel remedies announced by the Board majority in Thryv are permissible . . . ,” and agreed “to apply that precedent in the absence of three-member majority to overrule it.” Id. at slip op. 3 n.3.
In addition to the Thryv decision, there are a number of actions taken by the NLRB under the prior administration that the new Board may seek to reverse. Those actions include:
- a decision outlawing mandatory meetings between employers and employees to discuss unionization (Amazon.com Servs. LLC, 373 NLRB No. 136 (Nov. 13, 2024));
- a decision prohibiting employers from informing employees that unionization will interfere with the direct relationships between employers and employees (Siren Retail Corp. d/b/a Starbucks, 373 NLRB No. 135 (Nov. 8, 2024));
- a decision enabling unions to selectively pick units of pro-union employees to decide the issue of unionization (Am. Steel Constr., Inc., 372 NLRB No. 23 (Dec. 14, 2022));
- rules shortening the timeframe between the filing of an election petition and a secret ballot vote on unionization (see, e.g., 29 C.F.R. §§ 102.62, 102.63, 102.64, 102.66, 102.67, 102.69);
- a decision altogether eliminating secret ballot voting in certain instances (Cemex Constr. Materials Pacific, LLC, 372 NLRB No. 130 (Aug. 25, 2023)); and
- decisions imposing standards that transform standard employment agreements and employment policies into unfair labor practices (see, e.g., Stericycle, Inc., 372 NLRB No. 113 (Aug. 2, 2023); McLaren Macomb, 372 NLRB No. 58 (Feb. 21, 2023)).
There currently are no Board Member nominations pending, so it could take the NLRB significant time to revisit these issues. Although these issues currently are—and/or are likely to be—litigated at the federal circuit court of appeals level, the NLRB is known to adhere to existing Board precedent (outside of the specific case decided by such court) through its doctrine of nonacquiescence.
The NLRB has a new General Counsel whose initial focus is clearing the backlog of cases
As with Mayer and Murphy, the Senate confirmed President Trump’s nomination of Crystal Carey (R) as NLRB General Counsel in December 2025. She was sworn into office alongside Mayer and Murphy in January 2026.
Although it is common for the General Counsel to issue an initial memorandum identifying changes in precedent that s/he would like to pursue as the agency’s top prosecutor, Carey took a different approach. In her first memo, she announced her “priority is to address the backlog of cases, not add to it.” Memorandum GC 26-02 (Jan. 28, 2026). She further said that she “intend[s] to issue guidance on operational focused topics such as case processing, settlements, and remedies all aimed at achieving consistent, fair and prompt resolution of charges across the [a]gency.”
Carey’s memo followed one issued about a month earlier by then-Acting General Counsel William Cowen (R). The Cowen memo, which also focused on reducing the NLRB’s backlog of cases, identified a new agency-wide docketing protocol for handling unfair labor practice charges. The protocol requires a charging party to provide supporting evidence within two weeks of filing a charge. In addition, the memo highlights that the agency generally will not assign a Board agent to the case unless the evidence warrants it, and, even then, not until there is a Board agent with capacity to investigate the charge. This could result in the dismissal and/or withdrawal of charges early in the process, saving employers significant time and costs.
Although not explicitly stated in Carey’s memo, there is some language suggesting that the General Counsel may have little interest in prosecuting employers premised on some of the legal theories embraced by the Biden Board. Carey writes:
For too long we have been stuck in a cycle where justice to all parties is delayed in an effort to overturn precedent, overstep the boundaries of the National Labor Relations Act, restrict the rights of employees to freely obtain information and make informed decisions about representation, and interfere with the ability of parties to freely enter into various types of otherwise lawful employment-related agreements and settlements.
* * *
Regions have been informed to adhere to the standard list of required submissions to Advice, which includes, among other topics, cases involving a novel legal theory, remedies, or instances where there is no existing Board law, where the Region wishes to overturn precedent, or where cases involve existing Board precedent with a split in federal courts. The Division of Advice and Operations will coordinate directly with the Regions on these matters.
So, even without immediate change in Biden Board precedent, the General Counsel’s commitment to reducing the backlog could mean the General Counsel will focus on cases involving acts (if proven) that are well-established (non-partisan) violations of the NLRA, that she could be open to settling cases that may have been pursued to push the ideological envelope under the previous administration, and/or that she could seek a change in precedent in the event the agency still pursues such cases.
Conclusion
All employers should monitor future Board Member nominations, study subsequently issued General Counsel memoranda, consider appellate options, and strategize with experienced labor counsel.

Bridging the Gap: How Federal Workforce Investments Are Reshaping Employer Recruitment and Retention Strategies
The U.S. labor market has undergone a dramatic transformation over the past five years.
While the national worker shortage has largely stabilized, meaning the number of available workers now roughly matches open positions, the underlying structural challenges that created the shortage persist. An aging workforce, declining labor force participation, a childcare crisis, and a widening skills gap continue to constrain employers’ ability to recruit and retain the talent they need.
If businesses can’t fill their open roles, productivity lags, and so does economic growth. That ripple effect hits job creators, families, and the broader economy. Policymakers understand the consequences. To help ensure workers are ready to compete for jobs, several significant new programs are coming down the pike in 2026.
A childcare crisis keeping parents out of the workforce. Inaccessible and unaffordable childcare is one of the biggest barriers keeping workers, particularly women, from participating in the workforce. In 2020, 58 percent of working parents reported leaving work because they could not find adequate childcare, and in 2021, 79 percent of women who left the workforce cited home and family care as their reason.2 Women’s labor force participation currently sits at 57.2 percent4, well below the overall rate. These childcare challenges cause state economies to lose up to $9 billion annually.2
Talent is sitting on the sidelines. More than 79 million American adults, or one in three, has a criminal or arrest record leading to disproportionately high unemployment rates.5 Yet these second chance candidates perform just as well, if not better, than their counterparts without a record.
The rise of entrepreneurship. A record 5.5 million new business applications were filed in 2023, and the number has remained above 5 million every year since 2021.6 More Americans than ever are betting on themselves, mostly to open non-storefront retail shops or professional services firms. That’s great for innovation, but it further tightens the available labor pool.
These are not problems the market will correct on its own. They require policy action. In 2026, several major federal initiatives are giving employers new tools to upskill workers, build pipelines, and remove barriers to workforce participation.
The State of the Workforce: A Structural Problem, Not a Cyclical One
The labor force participation rate has trended downward for more than two decades. In 2000, participation hovered around 67 percent, but today it sits around 62 percent1, and the gap shows no signs of closing. Several forces are driving this decline.
Persistent state-level shortages. While a worker shortage no longer exists nationally, the reality on the ground varies dramatically. For example, South Dakota has as few as 41 available workers for every 100 open jobs, while California has a surplus with 153 per 100 openings.2 For employers in shortage states, recruiting is an uphill battle. But even in surplus states, having access to ample workers doesn’t mean having access to the right workers. The problem is as much geographical as it is a skills mismatch, and both make hiring harder.
Early retirements and an aging population. America has an aging population, and as a result, the number of Americans retiring hit record highs in 2023. The share of adults over 55 detached from the labor force due to retirement climbed from 48.1 percent in Q3 2019 to 50.3 percent in Q3 2021.3 By 2030, all baby boomers will be of retirement age, triggering a mass exodus of experienced workers from the labor force. At the same time, younger generations are having fewer children, meaning we are not replacing ourselves. Industries that serve aging Americans, like healthcare, will feel the squeeze hardest as demand for services rises while the number of professionals to deliver those services shrinks.
Workforce Pell Grants: A New Pipeline for Skilled Workers
On March 9, 2026, the U.S. Department of Education published a Notice of Proposed Rulemaking to establish the Workforce Pell Grant program, a key provision of the One Big Beautiful Bill Act signed into law on July 4, 2025.
Starting in July 2026, Pell Grants can fund high-quality, short-term workforce programs as short as 8 weeks, directly targeting the skills gap that employers have been struggling with for years. These programs must consist of 150 to 599 clock hours, take 8 to 15 weeks to complete, and lead to a recognized credential in a high-skill, high-wage, or in-demand occupation. Each program must be approved by the state’s Governor and the Secretary of Education and must meet completion and job placement benchmarks.
What this means for employers: Workforce Pell can create a federally funded pipeline of workers with short-term, industry-aligned credentials. Employers in healthcare, skilled trades, manufacturing, IT, and transportation should consider engaging with local community colleges and state workforce boards now to ensure programs align with their hiring needs.
Apprenticeship Expansion: $145 Million in Pay-for-Performance Funding
Upskilling existing workers is only part of the equation. Employees also need new entry points into the workforce. The Department of Labor announced in February 2026 up to $145 million for its Pay-for-Performance Incentive Payments Program, designed to scale the Registered Apprenticeship system toward one million active apprentices nationwide.
The program will award up to five cooperative agreements over four years, with individual awards ranging from $10 million to $40 million. Targeted industries include shipbuilding and defense; AI, semiconductor, and nuclear infrastructure; IT; healthcare; transportation; and telecommunications. Rather than providing money upfront, the model reimburses sponsors based on apprentice enrollment outcomes.
What this means for employers: Organizations that operate in a targeted industry could benefit from this direct funding opportunity. Registered Apprenticeship programs will also be treated as automatically meeting several Workforce Pell eligibility requirements, creating a streamlined system between these two programs. Full details are available on www.Apprenticeship.gov.
The Expanded Child Care Tax Credit (Section 45F)
The One Big Beautiful Bill Act also dramatically expanded the IRC Section 45F Employer-Provided Child Care Credit, effective January 1, 2026. For a credit that was barely utilized (fewer than 300 corporate returns claimed it in 20167), the changes are significant:
| Feature | Pre-2026 | 2026 and Beyond |
|---|---|---|
| Maximum annual credit | $150,000 | $500,000 ($600,000 for small businesses) |
| Credit rate on facility expenses | 25% | 40% (50% for small businesses) |
| Inflation indexing | No | Yes |
| Third-party intermediaries | Unclear | Explicitly eligible |
| Jointly owned/operated facilities | Not addressed | Explicitly qualified |
What this means for employers: The expanded credit changes the calculus for employers considering providing childcare benefits. An employer spending $1.2 million annually on contracted childcare can now claim a $500,000 credit, compared to just $150,000 under the old rules. Qualifying expenditures include on-site facilities, third-party provider contracts, tuition subsidies, and back-up care programs. Importantly, the enhancements to 45F now allow small businesses to pool resources and jointly operate facilities while still claiming the credit, lowering a barrier that previously made employer-provided childcare impractical for smaller employers. Given that childcare challenges are a primary driver of workforce non-participation, particularly among women, these changes give businesses a meaningful new tool for recruitment and retention. Guidance on the changes to 45F is forthcoming.
Second Chance Hiring: An Overlooked Talent Pool
As noted above, roughly 79 million Americans have some type of criminal record. Every year, more than 400,000 are released from federal and state prisons. Despite wanting to work, most sit on the sidelines, as the unemployment rate for Americans with records hovers around 30 percent.5
However, once hired, business and HR leaders agree that second chance employees perform just as well, if not better, than their peers without records. Further, second chance employees often demonstrate higher retention rates than their peers5. Federal policy making it easier for employers to tap into this talent pool is advancing.
On October 9, 2025, the Senate passed the Second Chance Reauthorization Act of 2025 (S. 1843) with a bipartisan vote of 77-20, reauthorizing critical grant programs through 2030 that fund reentry services, including career training, job placement, and treatment programs. The House companion bill (H.R. 3552) is still awaiting action.
Separately, the bipartisan Improve and Enhance the Work Opportunity Tax Credit (WOTC) Act would strengthen the financial incentive for employers to hire from this population, as well as other populations that experience high unemployment rates. Under current law, employers can claim a WOTC of up to $2,400 for each formerly incarcerated individual hired within one year of conviction or release. The proposed legislation would increase the credit rate from 40 percent to 50 percent of qualified first-year wages and double the qualified wage cap to $12,000 for employees who work 400 or more hours, bringing the maximum credit to $6,000 per hire. The bill would also index the credit to inflation and extend it for 5 years. WOTC has not been updated since its enactment 27 years ago.
What this means for employers: Together, the Second Chance Reauthorization Act and the Improve and Enhance the WOTC Act would give employers greater access to a supported and trained talent pool.
Looking Ahead
The workforce is older, smaller, and more selective about where and how it works, but the current policy landscape represents a coordinated strategy to better educate, train, and connect Americans to the workforce.
Employers that engage with these programs and build them into their workforce strategies will have a competitive advantage in the years ahead.
1 Bureau of Labor Statistics, Labor Force Participation Rate, FRED Economic Data, https://fred.stlouisfed.org/series/CIVPART
2 U.S. Chamber of Commerce, America Works Data Center, https://www.uschamber.com/workforce/america-works-data-center
3 Pew Research Center, “The pace of Boomer retirements has accelerated in the past year,” November 2021
4 Bureau of Labor Statistics, Women’s Labor Force Participation Rate, FRED Economic Data, https://fred.stlouisfed.org/series/LNS11300002
5 U.S. Chamber of Commerce, “Data Deep Dive: The Workforce Impact of Second Chance Hiring,” https://www.uschamber.com/workforce/data-deep-dive-the-workforce-impact-of-second-chance-hiring-3
6 U.S. Census Bureau, Business Formation Statistics, https://www.census.gov/econ/bfs/data.html
7 IRS Statistics of Income, 2016 corporate tax return data

A Cooling Labor Market Beneath the Headlines: What the Latest Jobs Data Means for Employers and Job Seekers
130,000 new jobs were added in January, with gains concentrated primarily in Healthcare.
At first glance, this appears to signal continued resilience in the labor market. However, downward revisions to prior months reveal that far fewer jobs were created in 2025 than previously estimated. The “low hire, low fire” environment was worse than most people even realized.
Hiring momentum appears to be slowing at the same time employers are announcing significant workforce reductions and historically low hiring plans.
In January alone, U.S.-based employers announced 108,435 job cuts, the highest January total since 2009, according to the January 2026 Challenger Report.
At the same time, employers announced just 5,306 hiring plans, the lowest January total since Challenger began tracking hiring announcements in 2009.
Modest job creation concentrated in one sector alongside elevated layoff announcements and weak hiring plans signals a labor market that is cooling and increasingly uneven.
Although headline employment figures show net job gains, labor market outcomes differ meaningfully across industries and populations.
What is Happening in the Labor Market?
Several forces are impacting employers simultaneously: artificial intelligence adoption, economic uncertainty and rising costs, shifts in labor supply, and evolving workforce priorities.
Artificial intelligence was cited in 7,624 January job cuts—about 7 percent of total reductions tracked by Challenger. AI is increasingly referenced in restructuring announcements as companies evaluate automation and productivity investments. While AI investments may drive growth in some areas, they are also prompting workforce realignment in others.
Meanwhile, companies in Retail, Manufacturing, and Consumer sectors continue to navigate tariff exposure and rising input costs. Many organizations buffered the impact of tariffs in 2025 by increasing inventory ahead of cost increases. As those inventories decline, margin pressure is reemerging. Persistent inflation, rising benefit costs, and uneven consumer demand further limited hiring appetite.
Labor supply trends are also playing a role. The foreign-born labor force has not fully recovered to pre-pandemic levels and recent policy enactments are further lowering foreign-born labor participation, contributing to slower overall labor force growth. At the same time, workforce participation patterns vary across demographic groups, reinforcing the uneven nature of the current environment.
Job Cut Announcements by Industry
Challenger’s January data shows that Transportation, Technology, Healthcare/Products, Chemical, and Financial sectors led announced job cuts for the month.
The reasons cited for reductions are instructive. Contract loss and market/economic conditions were the leading drivers of cuts, followed by restructuring and closures.
The current environment reflects repositioning. Many companies appear to be adjusting headcount following over-expansion, responding to inflationary or policy pressures, or realigning around efficiency and automation.
The Hiring Side of the Equation
While layoffs have drawn attention, hiring data is equally important. Employers announced just over 5,300 hiring plans in January, a significant drop compared to prior years and the lowest January total on record since tracking began in 2009.
Hiring has not stopped. Rather, it has become more measured and targeted. Organizations are filling essential roles, particularly revenue-generating or operationally critical positions, while pausing or reducing broader expansion plans.
For job seekers, this translates into longer timelines and increased competition, particularly at higher salary levels.
How Long Does a Job Search Take?
According to January 2026 Bureau of Labor Statistics data, the national average duration of unemployment is approximately 5.5 to 5.6 months. Opportunities exist, but searches are taking longer than in peak hiring cycles.
Challenger’s Q4 2025 client outcomes show that structured outplacement support significantly reduces time to placement.
Across all salary levels, Challenger clients secured new roles in an average of 2.7 months—nearly twice as fast as the national average.
The Q4 2025 breakdown by salary range reveals important patterns:
| Salary range | Time to placement |
|---|---|
| Under $50K | 1.57 months |
| $50,001–75K | 1.60 months |
| $75,001–100K | 1.76 months |
| $100,001–150K | 2.28 months |
| $150,001–200K | 2.39 months |
| $200,001–250K | 3.16 months |
| $250,001–500K | 4.40 months |
| $500,001+ | 6.31 months |
As compensation rises, the search naturally lengthens. Senior leaders face fewer openings, longer decision cycles, and more complex hiring processes. Executive searches are highly relationship-driven and often confidential, which further extends timelines.
How People Actually Find Jobs
Challenger’s Q4 2025 job source data provides further insight into how placements occur. Across all clients in Q4 2025:
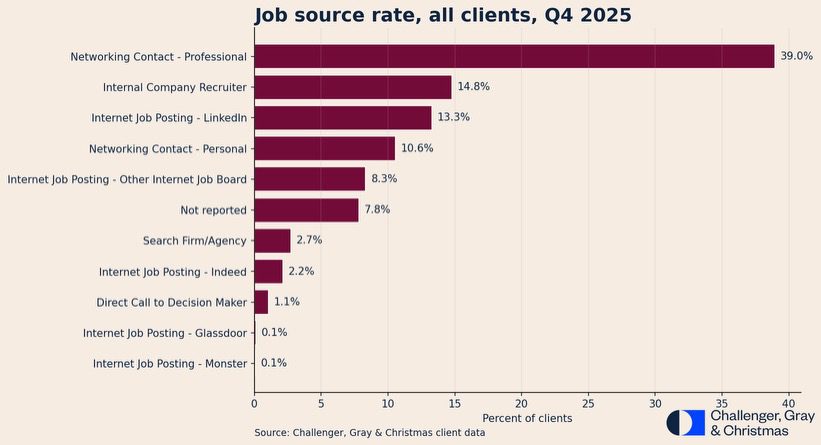
The takeaway is clear: networking remains the dominant path to new roles, but the emergence of LinkedIn as a major driver of new positions is not to be ignored.
Even as internet job postings rise in the ranks, professional networking alone drives nearly four in ten outcomes.
When broken out by salary range, the trend intensifies. At compensation levels above $250,000, professional networking becomes overwhelmingly dominant. Search firms also play a larger role at senior levels.
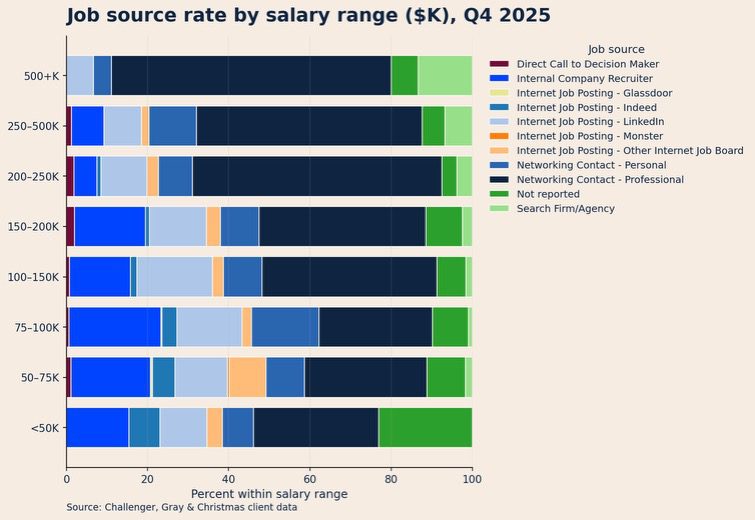
In contrast, at lower salary ranges, job boards and internal recruiters represent a more significant share of placements.
The higher the salary, the more relationship-driven the process becomes.
What This Means for Job Seekers
Job seekers should not lose hope. While conditions are not ideal for a job search at the macro level, individual companies are hiring. Challenger offered these tips to job seekers:
Expect a realistic timeline. Even in stable conditions, a professional job search takes time. Understanding that five to six months is the national average can help set expectations and reduce anxiety.
Advertise your job search. It feels counterintuitive in the moment, but in order to find your next role, you have to make it known that you’re looking. Tell your close friends and family and get your emotional support system built.
Network, network, network. Outreach should be targeted, thoughtful, and consistent. Aim to meet with five contacts a week. Reconnect with former colleagues, industry peers, alumni networks, and professional associations. Meet for coffee with your kids’ coaches, friends of neighbors, or people from your church or volunteer activity. It’s most likely you’ll find a new position from friends of friends, rather than those most close to you.
Remember that people like to help and give advice. Don’t use these meetings to ask for a job, necessarily, but discuss your value and skills and ask advice on how your contacts got to where they are in their careers.
Use job boards strategically rather than exclusively. Submitting applications is necessary, but relying solely on online postings dramatically reduces visibility and differentiation.
Have an elevator pitch of your value proposition. In competitive markets, a clearly articulated value proposition matters. Employers are hiring with precision. Candidates who can define their impact, metrics, and differentiators stand out.
Implications for Employers
For employers, the current environment presents both risk and opportunity.
Layoffs and restructuring, when handled thoughtfully, allow organizations to recalibrate and invest strategically. However, poorly managed reductions can damage employer brand, morale, and long-term retention.
Outplacement support demonstrates commitment to employees during transitions while also protecting organizational reputation.
Data consistently show that employees who feel their colleagues were treated fairly remain more engaged and trusting.
Additionally, employers should recognize that selective hiring markets still require speed and clarity.
High performers, particularly at senior levels, have options. Delayed decision-making can cost organizations top talent.
A Labor Market in Transition
The present labor market is neither booming nor collapsing. It is transitioning.
Job growth continues, but it is narrower. Layoffs are elevated in certain sectors, yet hiring has not disappeared.
Employer caution reflects macroeconomic uncertainty, cost pressures, and evolving technology adoption.
Job seekers need to enter the market with realistic expectations and armed with exactly what they bring to an employer. For employers, the moment requires planning and foresight for hiring, retention, and workforce restructurings.
The headline number of 130,000 jobs added offers reassurance. The deeper data, including revisions, hiring plans, layoff announcements, and job search duration, provide the context.
In this environment, success belongs to those who approach the market deliberately.
About Challenger, Gray & Christmas
Challenger, Gray & Christmas is the premier global outplacement and executive coaching firm, providing expert guidance to organizations and individuals navigating career transitions. With a history spanning more than 50 years, Challenger partners with companies of all sizes and industries to deliver customized workforce solutions that support employee success. Our executive coaching services help leaders enhance their effectiveness, develop critical skills, and drive business performance. Rooted in authenticity, empathy, and a commitment to doing the right thing, Challenger empowers organizations to foster resilient, high-performing teams. For more information, visit www.challengergray.com.
Heather Linz is Vice President of Challenger, Gray & Christmas with over 20 years of workforce planning and human resources experience. She is responsible for building relationships and supporting businesses particularly in Western Michigan, Detroit and Toledo.
Toni Thomas serves as Regional Manager of Challenger, Gray & Christmas supporting greater Philadelphia and eastern Pennsylvania. She is a trusted advisor to human resources professionals, as well as an active participant in the Philadelphia Society of People & Strategy (PSPS), where she co-leads the Corporate Membership Committee.

Intentional Survivor Management: No One Is “Lucky” in a Layoff
Much is made about the impact of layoffs on those who lose their jobs—and rightly so—but far less attention is paid to the employees who remain. These “survivors” are left to navigate uncertainty, increased workload, and emotional fallout. We sat down with Dr. Fiona Jamison to discuss why survivor management matters and how organizations can approach it intentionally.
Why is this topic especially important right now? Are layoffs increasing?
Yes, very much so. You only need to look at today’s business headlines to see widespread layoffs occurring across companies traditionally considered stable—large retailers, logistics firms, technology companies, and major infrastructure organizations. These are not small workforce reductions; in many cases, tens of thousands of employees are being let go.
Some of this reflects corrections after over-hiring during the pandemic, but layoffs have increasingly become a default response to uncertainty, particularly amid rapid advances in technology and AI. While AI is often cited as the driver, that explanation can be overly simplistic. What we are really seeing is a structural shift: administrative roles are being automated, middle management layers are being removed, and spans of control are expanding.
This is risky. Research consistently shows that, as managers’ spans of control increase, effectiveness declines, employee engagement drops, and connection to the organization weakens. These dynamics create long-term challenges that organizations often underestimate when making short-term cost decisions.
Fiona, when did you first begin studying the impact of downsizing on survivors? What sparked your interest in this area?
My interest began in 1997 and ultimately became the foundation of my PhD research. At the time, the UK was experiencing widespread privatization and large-scale layoffs, particularly across industrial sectors such as utilities, telecommunications, power generation and coal mining. A government-sponsored research initiative sought to understand the broader impacts of these changes, but most existing research focused almost exclusively on individuals who were laid off.
As an industrial-organizational psychologist, I was far more interested in the employee experience of those who remained. These individuals were expected to carry on, often under dramatically altered conditions, yet their experiences were largely overlooked. What’s striking is how consistent the findings have been over time. Organizations go through cycles of contraction and growth, and the psychological and organizational impacts on survivors today look remarkably similar to what we observed in the late 1990s.
Survivors are often described as the “lucky” ones. What challenges do they actually face?
The idea that survivors are “lucky” is deeply misleading. After a mass layoff, employees experience a profound loss of psychological safety. The unspoken question becomes, “If this happened once, could I be next?”
Employees also closely observe how their colleagues were treated. Were people treated with dignity and respect? Were their contributions acknowledged? Or were they abruptly removed with little communication? These perceptions shape how survivors judge the organization—and that judgment directly influences how they show up at work.
When employees believe layoffs were handled unfairly, they tend to withdraw. They protect information, limit collaboration, and focus on self-preservation rather than collective success. This undermines performance and culture.
There is also a significant emotional toll. Survivors often experience grief and guilt, particularly when long-standing colleagues and friends are impacted. At the same time, workloads increase, role clarity decreases, and priorities are rarely recalibrated effectively. Organizations frequently forget to clearly articulate what the future looks like post-layoff and how employees are expected to contribute to it. That lack of direction compounds stress and disengagement.
You often talk about “Intentional Survivor Management.” What does that involve?
Intentional Survivor Management starts with acknowledging that layoffs are not a discrete event—they create an emotional and organizational aftermath that must be actively managed.
Our research points to four critical areas:
First, listening. Organizations must create space for employees to express what they are feeling—whether that is frustration, fear, anger, or uncertainty. This can take many forms: town halls, focus groups, pulse surveys, or structured listening sessions. What matters is that employees feel heard.
This is especially important for managers. Many of them delivered the layoff messages and are now absorbing pressure from both senior leadership and their teams. Providing managers with targeted support and safe forums is essential at this stage.
Second, rebalancing. When teams shrink, priorities must be reset. Managers need to have explicit conversations about what work will continue, what will stop, and what success looks like with fewer people. Without this, employees are simply asked to do more with less, which breeds resentment and burnout.
Third, communication. Employees do not “move on” simply because leadership has. Clear, frequent communication about the organization’s direction, strategy, and future is critical. Importantly, messages should not come only from the top. Trust is often fractured after layoffs, so organizations need credible voices at multiple levels—regional leaders, respected managers, and informal influencers—to reinforce and contextualize messages.
Finally, rebuilding. This is about intentionally shaping the culture of the new organization. What behaviors are expected now? What practices no longer make sense? How do new technologies and structures change how work gets done? Rebuilding culture deliberately is what ultimately restores trust in leadership.
When organizations approach these four areas—listening, rebalancing, communicating, and rebuilding—as a cohesive strategy, they significantly reduce the risk of prolonged disengagement.
How long should survivor management last? Is this short-term or ongoing?
It depends on the organization and the scale of the layoffs, but as a general rule, leaders should plan for at least a year of intentional survivor management. Recovery does not happen quickly, and repeated layoffs reset the clock each time.
How can leaders tell whether their survivor management efforts have been successful?
Most organizations already track employee engagement or experience in some form. Following a layoff, engagement scores typically drop by 30 to 40 points. If an organization can maintain engagement—or see it rebound—that is a strong indicator of effective survivor management.
The key is consistency. Metrics used before layoffs should continue afterward. If survivor management is working, voluntary turnover should not increase, engagement should stabilize, and patterns of PTO and benefit usage should remain relatively steady.
When it isn’t working, organizations see disengagement, increased attrition among high performers, and higher absenteeism. Unfortunately, one of the first things companies often cut during layoffs is employee listening—such as engagement surveys. That is a serious mistake. Eliminating your ability to measure sentiment leaves leaders blind at precisely the moment insight is most needed.
Any final thoughts for leaders navigating layoffs?
If you are in a leadership role and are facing—or have recently gone through—layoffs, it is critical to focus not only on how the layoffs are executed, but on what happens afterward. The aftermath determines whether your organization stabilizes or continues to erode.
This is where external support can be invaluable. Organizations like People Results can help leaders design survivor management plans, identify the right employee listening questions, and navigate this complex period with greater confidence. Layoffs are never easy, but handling the post-layoff phase well makes a meaningful difference—for employees and for the long-term health of the organization.

Post-Strike Healing: It’s Not Over Til It’s Over
Introduction
A strike’s end is all too often perceived as the end of the uncertainty and tension and an automatic “return to normal.” In truth, the end of a strike doesn’t put an end to the issues that started it or to the negative feelings the strike may have fostered within the workforce. The end of a strike also doesn’t mean resolution to the damages the strike may have caused to the business, its reputation, or to the relationships both within and without the organization. Instead, the end of a strike is an organizational hurdle—one that can escalate into a significant obstacle to long-term business outcomes if not handled with efficiency and sensitivity.
Post-Strike Interventions
A midwestern manufacturing facility was anticipating the end of a lengthy strike, during which the strikers did physical damage to the facility and the community was enraged at the amount of time their family members were out of work. Leadership in the facility contacted People Results for a Post-Strike Intervention, seeking to rebuild their team’s trust and connection and calm members of the community through the way they welcomed back employees, both strikers and non-strikers.
When employees return to work after a strike, three groups of employees are impacted—leadership, office or administrative support, and returning strikers—each in different ways. In addressing these groups and how they were impacted, individual emotions and work performance must be kept in mind. Each group will benefit from different but similar interventions.
Leadership
Leader behavior sets the tone for how returning employees respond once they are back on the job. A leader’s behavior is the result of how the leader feels about the strike and its causes, as well as how they feel their executive leadership responded to it. Because of this, People Results’ approach to supporting leaders in a post-strike environment is two-pronged and includes the actions that must occur both before strikers return and after strikers return.
In the “before” sessions with leaders, People Results’ consultants validate the emotions leaders may be experiencing about the situation. Emotions may range from feeling sympathetic toward the strikers to being outraged by their behavior during the strike or by the damage done to the facility or the organization’s reputation. We also clarify and reinforce the role of the leader to set the tone for individual and organizational success. It’s at this point that we ask leaders to create an individualized, genuine message to welcome back their teams and refocus day-to-day attention on meeting customer requirements. Additionally, we review the employee communication channels and processes the organization has in place to hear and respond to its workers’ voices. We ask leaders to try and anticipate the various types of responses they might receive from their employees and agree on how best to manage each type. Finally, we introduce a process for holding small group debriefs that leaders could use to acknowledge team members’ feelings about operational workplace issues and reinforce the organization’s process to hear and respond to team members.
Once employees return to the workplace, we meet with leaders once again to find out how things went. We ask them what they experienced with their teams, whether it went as anticipated, and whether they learned anything about themselves, their leadership style, or their individual team members in the process. We also discuss how they might use this experience to become a better leader in the future.
Office or Administrative Support
Leaders aren’t the only ones who may be working through feelings after a strike. Like the leaders, the responses of office or administrative support staff may range from feelings of sympathy toward the strikers to feelings of hurt and outrage because of the strike’s impacts and strikers’ behaviors. This group needs to know that how they respond to both leaders and returning employees will affect the time it takes to stabilize the organization and the ability for the workplace to return to expected levels of teamwork and productivity. Helping staff members prepare for the strikers’ return will allow them to support leaders. It will also show them that they are an important part of the process of building and supporting the culture moving forward.
Like the “before” session with leaders, in our session with office/administrative support, we first validate their feelings and then clarify their role in supporting the organization’s culture. We also review communication and influence skill basics to foster effective communication throughout the organization. And again, as with the leaders, we ask these staff members to create their own welcome-back message. Finally, we review the proper channels for staff to voice their concerns about returning workers, as well as the processes in place for responding to workplace disruptions.
Returning Strikers
Last, but certainly not least, are the returning strikers. Returning strikers bring any number of thoughts and feelings post-strike, ranging from “I really didn’t want to do this but felt like I had to,” to “I’m disappointed, angry, furious, resigned.” How they’re greeted when they return—and even more importantly, how their first week or so unwinds—will set the tone for how willing or comfortable they are to reconnect with their team and refocus their day-to-day attention on meeting customer requirements. That’s why, in the first week of their return, former strikers at the midwestern manufacturing facility benefited from one-on-one, focused meetings with their managers where their voices were heard, they revisited cultural and performance expectations, and they recommitted to doing the best job they could for their teams and their customers.
As with the leaders and the staff before them, the first step in sessions with returning strikers is to validate their emotions. Equally important is to reinforce the organization’s desire to hear and respond to workers about their workplace concerns. In the wake of a strike, it is also useful to clarify the organization’s expectations for teamwork and meeting customer needs, both issues that may be rocky in this time of adjustment. That’s why we also take the time to review the proper channels for employees to voice their concerns about work, co-workers, or leaders, as well as those processes already in place to respond to workplace disruptions.
Post-Strike Recovery
Recently, a state hospital association invited People Results to their annual Human Resources meeting to discuss strike recovery, particularly in regard to workforce strategy and culture restoration. Strikes disrupt more than just the individuals on the picket line—they can and will disrupt the core of an operation, and repairing these core elements is critical to an organization’s future health and resilience.
In this meeting, we explored the most important priorities for Post-Strike Recovery, which are:
- Rebuilding trust – this is done by acknowledging the experience of the strike, resetting the tone of leadership, and creating visible commitments to change
- Stabilizing your workforce so that you may begin optimizing it – the simple fact of the matter is you cannot drive performance until people feel safe, valued, and heard
- Redesigning the employee value proposition – a strike is a clear referendum on the employee experience and reveals a misalignment between what employees expect and what the organization delivers
- Shifting labor relations from reactive to strategic – the goal is not simply to avoid another strike, but to prevent the conditions that make one inevitable
- Aligning leadership around a shared future state of the organization – corporate culture is determined in the months after a strike, and fragmented leadership messages can undermine recovery
How do you hit all these topics in the aftermath of a strike action? By remembering the Three Horizons of Post-Strike Recovery, which are:
- Stabilize – In the first 3 months after a strike, restore operations and staffing ability, manage reintegration and morale, and align internal and external messaging
- Reset – From 3 to 12 months after a strike, redesign your employee value proposition, rebuild leadership capability, and address any inequities across unions and roles
- Reimagine – From month 12 to 36, institutionalize labor management partnerships, modernize workplace models (within regulatory restraints), and create early warning systems for workforce risk
Conclusion
When a strike ends, everyone wants to put the pain behind them and move forward, but as we’ve seen, strikes leave their marks on the people, the operations, the reputation, and the future of organizations. That is why it’s not over until the healing and recovery is complete. As you’ve seen here, that can be a long process, extending over months and years. The good news is that, if timely Post-Strike Interventions take place and intentional care is taken to address the organization’s overall Post-Strike Recovery, this process will result in a stronger culture of positive employee relations.
Targeted negotiations communications spell bargaining success
A new health system recently formed from the merger of two organizations needed to mitigate a multi-faceted, politically charged union corporate campaign while negotiating new labor contracts at four locations simultaneously. The union launched a sophisticated campaign challenging the health system’s commitment to patient care and claiming it was more focused on profitability—even as a not-for-profit organization. People Results developed a reputation management campaign, “We Put Patients First,” that drowned out the union’s rhetoric through multiple media channels, including a campaign website, print advertising, a social media campaign targeted by ZIP Code, signage and banners, and other tactics. To quote Mad Men, “If you don’t like what’s being said, change the conversation.” And, as this organization discovered, whether you face one bargaining table or four all at once, People Results can always help you change the conversation for the better.
Issue
- Employee communications were needed to share the company’s perspective on bargaining progress
- Communications needed to be internal as well as community-facing to counter a multi-faceted, state-wide corporate campaign
- Targeted messaging needed to reach different locations
Action
- Developed a comprehensive reputation management strategy centered on a negotiations website
- Promoted the website through multiple channels, including a digital media campaign targeted by ZIP Code
- Initiated a community-facing reputation campaign for the company, highlighting corporate citizenship, community commitment, and patient care
- Connected the negotiations website to the reputation campaign for maximum reach
- Supplemented these efforts with digital and social media ads to drive traffic to the site
Result
- Contracts were ratified at all four locations, with unionized employees receiving effectively the same pay, benefits, etc., as non-union employees
- Threatened strikes were averted at all four locations
- Neutrality Agreement was rejected
- Organizing campaigns were deflected


bargaining
success
Enhancing leadership readiness through strategic training
A leading healthcare system with 10 hospitals, 500+ locations, and 33,000 employees sought to strengthen leadership preparedness in labor relations and workforce management. As labor dynamics evolved, leadership recognized the need for a structured, ongoing training approach that would equip managers with the skills to handle complex workplace challenges, engage employees effectively, and proactively address labor-related concerns. To meet these objectives, the organization partnered with People Results to develop a multi-faceted training strategy that blended scenario-based learning, leadership development, and communication tools. This initiative ensured that leaders across all facilities remained informed, confident, and capable of fostering a positive work environment, while also navigating labor relations with clarity and confidence. Through immersive leadership practice sessions, structured learning reinforcement, and digital engagement tools, the organization created a comprehensive, scalable solution to enhance leadership effectiveness and workforce alignment.
Issue
- Leadership Preparedness – Leaders needed training to proactively address labor relations and workforce challenges
- Employee Engagement and Trust – Managers required skills to build transparency and strengthen workplace relationships
- Consistent Learning and Reinforcement – A system-wide approach was needed to ensure sustained leadership development
Action
- Scenario-Based Training – Leadership practice sessions provided real-time, hands-on learning for workplace scenarios
- Multi-Channel Learning Tools – Podcasts, newsletters, and digital content supported continuous development
- Data-Driven Improvements – Enhanced engagement tools, including surveys and analytics, measured training effectiveness
Result
- Improved Leadership Confidence – Leaders felt better equipped to manage workplace issues and labor relations
- Improved Conflict Resolution – 95 percent of leaders said the training enhanced their ability to effectively manage and resolve workplace conflicts
- Sustained Learning Culture – Leaders consistently rated training as valuable, reinforcing best practices across all locations
leadership
development


Cultivating a collaborative workforce through standardized pay practices
A large academic health system with over 28,000 employees across 13 counties faced the challenge of integrating multiple facilities under a standardized pay system. Historically, each member organization operated independently, with its own policies and systems. Leadership sought to align pay practices while maintaining employee trust and engagement. The systemwide changes were part of a broader effort to create consistency and efficiency across the organization. To ensure a smooth transition, leadership prioritized transparent communication, proactive change management, and direct employee engagement. The goal was to minimize disruption, support managers, and provide clear messaging that reinforced the benefits of standardization.
Issue
- Fragmented Pay Practices – Employees across different facilities had varying pay structures, policies, and systems, leading to inconsistencies
- Change Fatigue – Employees had already experienced significant organizational shifts, making additional changes more difficult to implement
- Leadership Transitions – A new CEO and leadership team needed to quickly align with and champion the pay standardization effort
Action
- Leadership Engagement – Created an executive steering committee and workgroups to drive the change and ensure alignment across departments
- Strategic Communication – Developed a branded initiative to frame pay standardization as part of the system’s broader unification efforts
- Manager Enablement – Provided a comprehensive toolkit and training and dedicated communication resources to help leaders guide their teams through the transition
Result
- Successful Implementation – The system transitioned more than 20,000 employees to standardized pay practices with minimal operational disruption
- High Employee Trust – Transparent messaging and leadership alignment led to positive feedback and improved confidence in systemwide initiatives
- Minimal Payroll Issues – On launch day, only 10 percent of HR support cases were related to pay, and fewer than 50 employees required paycheck adjustments


change
management
Summary of petitions filed and elections held
| All Industries — summary of petitions filed and elections held (2016–2025) | ||||||||||
|---|---|---|---|---|---|---|---|---|---|---|
| 2016 | 2017 | 2018 | 2019 | 2020 | 2021 | 2022 | 2023 | 2024 | 2025 | |
| Total Petitions | 2,281 | 2,274 | 1,902 | 2,033 | 1,552 | 1,683 | 2,500 | 2,675 | 3,108 | 2,447 |
| Total Representation Petitions | 1,970 | 1,937 | 1,573 | 1,774 | 1,352 | 1,412 | 2,185 | 2,361 | 2,793 | 2,150 |
| Total RC Petitions | 1,914 | 1,876 | 1,542 | 1,732 | 1,306 | 1,383 | 2,159 | 2,158 | 2,364 | 1,948 |
| Total RM Petitions | 56 | 61 | 31 | 42 | 46 | 29 | 26 | 203 | 429 | 202 |
| Union Not Elected | 368 | 395 | 340 | 307 | 258 | 251 | 387 | 365 | 449 | 329 |
| Union Elected | 969 | 989 | 830 | 925 | 605 | 740 | 1,221 | 1,342 | 1,587 | 1,170 |
| Total Decertification (RD) Petitions | 311 | 337 | 329 | 259 | 200 | 271 | 312 | 314 | 315 | 297 |
| Union Not Elected | 103 | 123 | 110 | 103 | 55 | 84 | 103 | 110 | 116 | 69 |
| Union Elected | 62 | 60 | 61 | 56 | 49 | 59 | 56 | 59 | 49 | 54 |
| Healthcare — summary of petitions filed and elections held (2016–2025) | ||||||||||
|---|---|---|---|---|---|---|---|---|---|---|
| 2016 | 2017 | 2018 | 2019 | 2020 | 2021 | 2022 | 2023 | 2024 | 2025 | |
| Total Petitions | 401 | 410 | 291 | 318 | 271 | 297 | 370 | 408 | 535 | 428 |
| Total Representation Petitions | 351 | 351 | 228 | 277 | 239 | 231 | 314 | 370 | 492 | 390 |
| Total RC Petitions | 342 | 325 | 223 | 272 | 227 | 229 | 312 | 349 | 439 | 363 |
| Total RM Petitions | 9 | 26 | 5 | 5 | 12 | 2 | 2 | 21 | 53 | 27 |
| Union Not Elected | 50 | 61 | 35 | 32 | 36 | 29 | 53 | 34 | 37 | 39 |
| Union Elected | 201 | 225 | 151 | 168 | 124 | 148 | 181 | 256 | 317 | 267 |
| Total Decertification (RD) Petitions | 50 | 59 | 63 | 41 | 32 | 66 | 56 | 38 | 43 | 38 |
| Union Not Elected | 19 | 11 | 24 | 10 | 5 | 18 | 15 | 12 | 14 | 5 |
| Union Elected | 13 | 15 | 12 | 10 | 11 | 15 | 15 | 5 | 6 | 12 |
| All Non-Healthcare Industries — summary of petitions filed and elections held (2016–2025) | ||||||||||
|---|---|---|---|---|---|---|---|---|---|---|
| 2016 | 2017 | 2018 | 2019 | 2020 | 2021 | 2022 | 2023 | 2024 | 2025 | |
| Total Petitions | 1,880 | 1,864 | 1,611 | 1,715 | 1,281 | 1,386 | 2,130 | 2,267 | 2,573 | 2,019 |
| Total Representation Petitions | 1,619 | 1,586 | 1,345 | 1,497 | 1,113 | 1,181 | 1,871 | 1,991 | 2,301 | 1,760 |
| Total RC Petitions | 1,572 | 1,551 | 1,319 | 1,460 | 1,079 | 1,154 | 1,847 | 1,809 | 1,925 | 1,585 |
| Total RM Petitions | 47 | 35 | 26 | 37 | 34 | 27 | 24 | 182 | 376 | 175 |
| Union Not Elected | 318 | 334 | 305 | 275 | 222 | 222 | 334 | 331 | 412 | 290 |
| Union Elected | 768 | 764 | 679 | 757 | 481 | 592 | 1,040 | 1,086 | 1,270 | 903 |
| Total Decertification (RD) Petitions | 261 | 278 | 266 | 218 | 168 | 205 | 256 | 276 | 272 | 259 |
| Union Not Elected | 84 | 112 | 86 | 93 | 50 | 66 | 88 | 98 | 102 | 64 |
| Union Elected | 49 | 45 | 49 | 46 | 38 | 44 | 41 | 54 | 43 | 42 |
Maps of representation petitions filed in healthcare
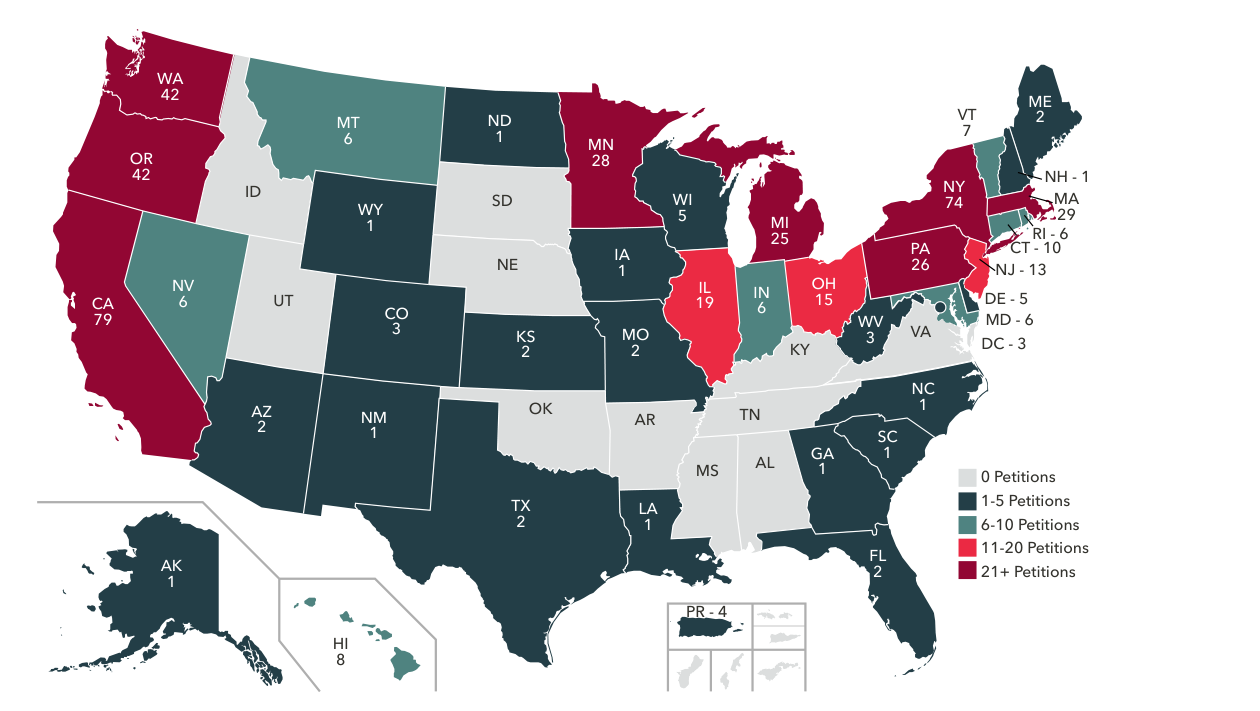
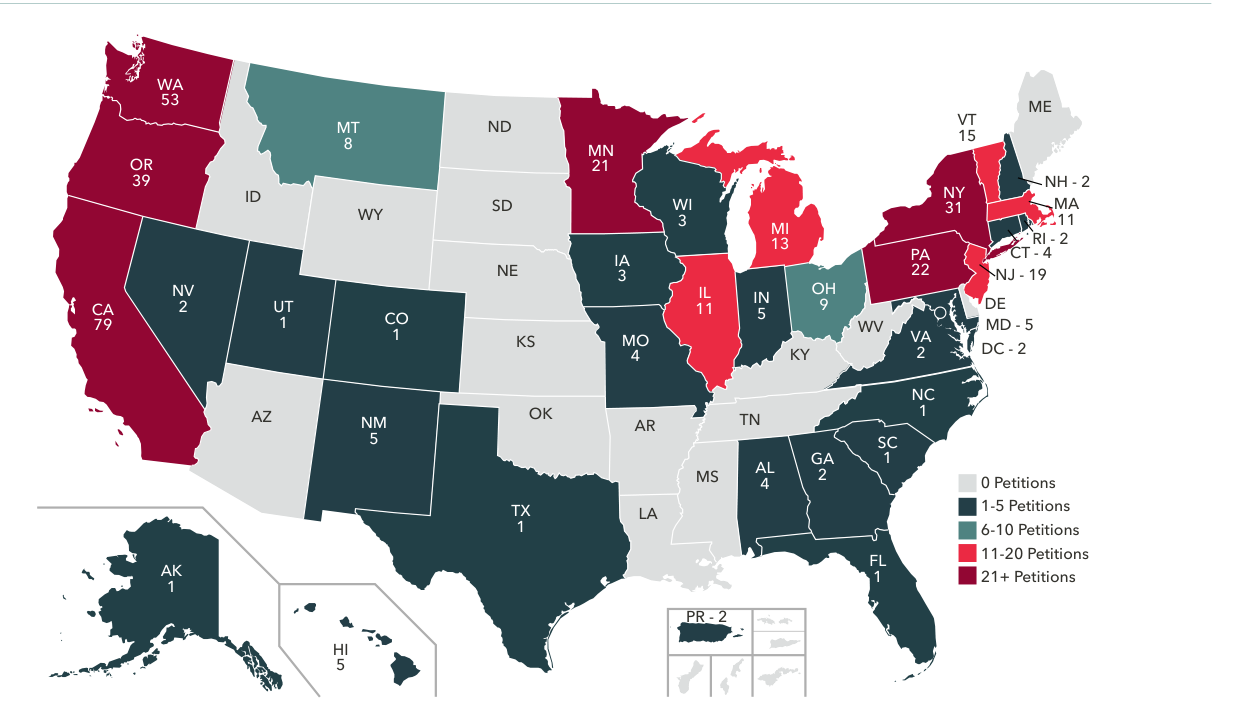
National Labor Relations Board definitions
What is the National Labor Relations Board?
The National Labor Relations Board (NLRB) is an independent federal agency established to enforce the National Labor Relations Act (NLRA). As an independent agency, the NLRB is not part of any other government agency, such as the Department of Labor.
Congress has empowered the NLRB to conduct secret ballot elections so employees may exercise a free choice whether a union should represent them for bargaining purposes. A secret ballot election will be conducted only when a petition requesting an election is filed. Such a petition should be filed with the Regional Office in the area where the unit of employees is located. All Regional Offices have petition forms that are available upon request and without cost.
Types of petitions
1. Certification of Representative (RC)
This petition, which is normally filed by a union, seeks an election to determine whether employees wish to be represented by a union. It must be supported by the signatures of 30 percent or more of the employees in the bargaining unit being sought. These signatures may be on paper. This designation or “showing of interest” contains a statement that the employees want to be represented for collective-bargaining purposes by a specific labor organization. The showing of interest must be signed by each employee, and each employee’s signature must be dated.
2. Decertification (RD)
This petition, which can be filed by an individual, seeks an election to determine whether the authority of a union to act as a bargaining representative of employees should continue. It must be supported by the signatures of 30 percent or more of the employees in the bargaining unit represented by the union. These signatures may be on separate cards or a single piece of paper. This showing of interest contains a statement that the employees do not wish to be represented for collective-bargaining purposes by the existing labor organization. The showing of interest must be signed by each employee, and each employee’s signature must be dated.
3. Withdrawal of Union-Security Authority (UD)
A “UD petition,” which can also be filed by an individual, seeks an election to determine whether to continue the union’s contractual authority to require that employees make certain lawful payments to the union to retain their jobs. It must be supported by the signatures of 30 percent or more of the employees in the bargaining unit covered by the union-security agreement. These signatures may be on separate cards or a single piece of paper. This showing of interest states that the employees no longer want their collective bargaining agreement to contain a union-security provision. The showing of interest must be signed by each employee, and each employee’s signature must be dated.
4. Employer Petition (RM)
This petition is filed by an employer for an election when one or more unions claim to represent the employer’s employees or when the employer has reasonable grounds for believing the union that is the current collective-bargaining representative no longer represents a majority of employees. In the latter case, the petition must be supported by the evidence or “objective considerations” relied on by the employer for believing that the union no longer represents a majority of its employees.
5. Unit Clarification (UC)
This petition seeks to clarify the scope of an existing bargaining unit by, for example, determining whether a new classification is properly a part of that unit. The petition may be filed by either the employer or the union.
6. Amendment of Certification (AC)
This petition seeks the amendment of an outstanding certification of a union to reflect changed circumstances, such as changes in the name or affiliation of the union. This petition may be filed by a union or an employer.
Bargaining units for acute care hospitals
The following are employee categories for acute care hospitals (for the purposes of determining bargaining unit), as defined by the National Labor Relations Board.
Registered Nurses (RNs)
Nurses who have graduated from a formal program of nursing education (diploma school, associate degree, or baccalaureate program) and are licensed by the appropriate state authority.
Professional Employees
Employees with four-year degrees or beyond (except RNs and physicians). These employees typically work in jobs that are intellectual and involve consistent exercise of discretion and judgment (e.g., pharmacists, physical therapists).
Technical Employees
Employees with some significant, distinct, specialized course of training beyond high school. Other factors considered will be length of training (generally more than six months), state or governmental licensing, or formal certification process (e.g., lab techs, respiratory therapists, radiology technicians).
Security Guards
Employees who provide security service to the hospital, its property, grounds, buildings, employees, and patients.
Skilled Maintenance Employees
Employees who provide skilled maintenance and/or engineering services (e.g., sanitary engineers, licensed electricians, plumbers).
Business Office Clerical Employees
Clerical employees who perform business office functions and/or who have a strong working relationship with the business office functions; general clerical should be classified as “service worker.”
Physicians
Licensed physicians who are “employees” of the hospital.
Service and Non-Professional Employees
This unit will generally include all service and unskilled maintenance employees. Employees in this category typically perform manual and routine job functions and are not highly skilled or trained.
Other/Combined Job Classifications
Any jobs not listed above or units covering more than one of the above categories.